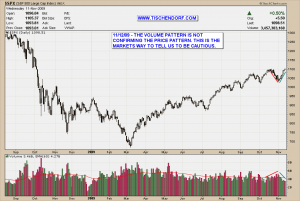
Yesterday I wrote about the volume pattern not confirming the price advance. I used SIO.V – Sensio Technologies as an example. You can spot the same divergence with the S&P 500. Ideally you want volume to confirm a price advance. Actually the S&P 500 chart below is sending two messages corroborating the non-confirmation:
- Increasing volume confirmed the recent down-move. Red lines in the chart.
- Decreasing volume didn’t confirm the recent up-move. Green lines in the chart.
As I’ve stated before, in the end price trumps volume and indicators. Still, these divergences are part of the market’s message. The market is always talking – as traders we simply listen.
Up-to-date Daily S&P 500 Chart on my public list.
Up-to-date Weekly S&P 500 Chart on my public list.
Have a great evening!
