Received a very nice Testimonial from long-time Member Jeff Roark describing what you get as a Member of the Tischendorf Letter Premium and portraying his successful journey towards becoming a full-time trader. Thank you Jeff! Your equity curve chart you shared with me looks outstanding. Well done! Congratulations!
Tischendorf Letter Premium – Member Testimonial
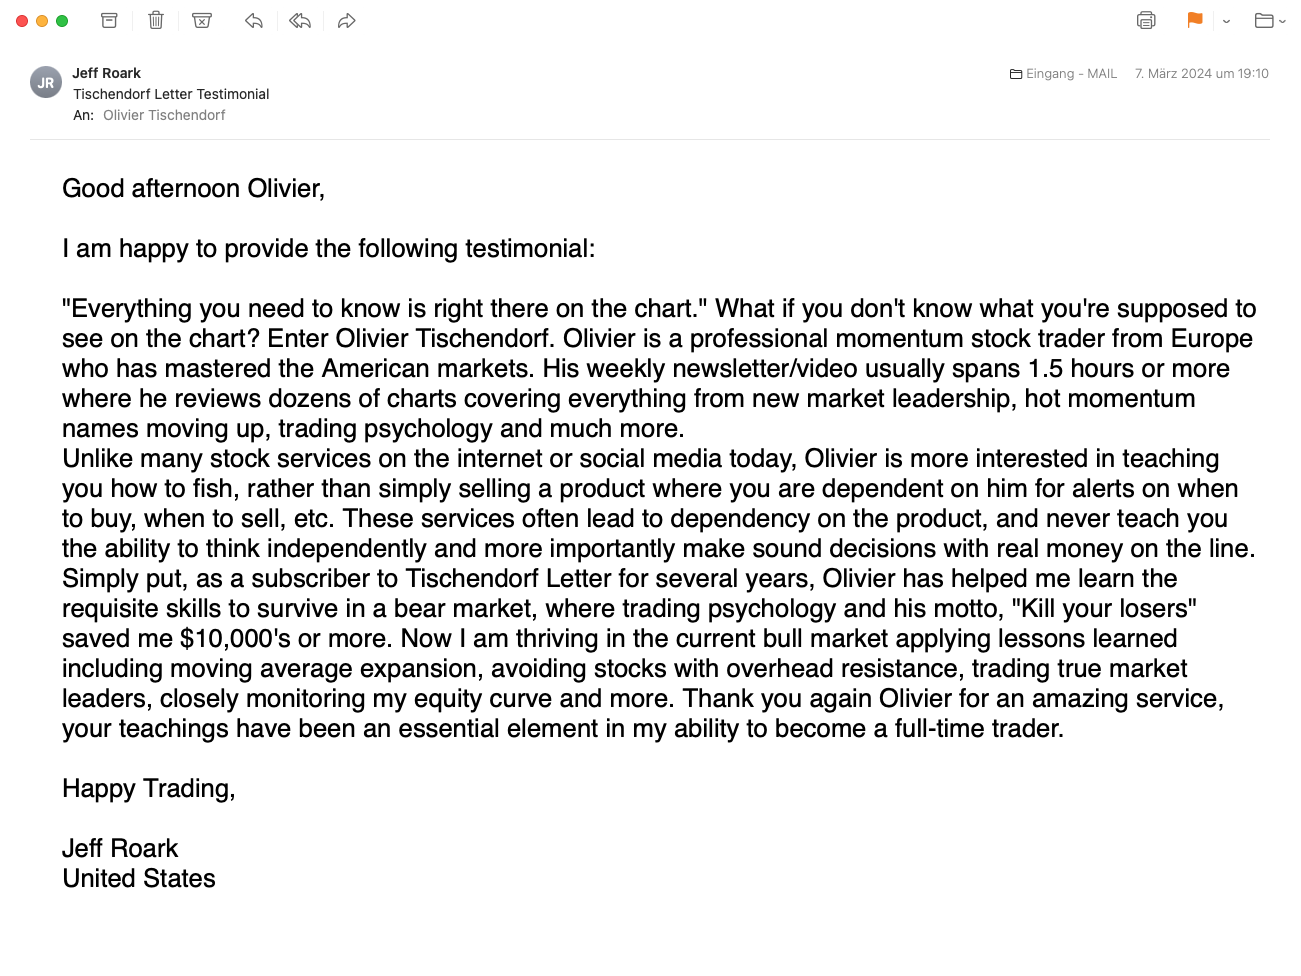
Good afternoon Olivier,
I am happy to provide the following testimonial:
“Everything you need to know is right there on the chart.” What if you don’t know what you’re supposed to see on the chart? Enter Olivier Tischendorf. Olivier is a professional momentum stock trader from Europe who has mastered the American markets. His weekly newsletter/video usually spans 1.5 hours or more where he reviews dozens of charts covering everything from new market leadership, hot momentum names moving up, trading psychology and much more.
Unlike many stock services on the internet or social media today, Olivier is more interested in teaching you how to fish, rather than simply selling a product where you are dependent on him for alerts on when to buy, when to sell, etc. These services often lead to dependency on the product, and never teach you the ability to think independently and more importantly make sound decisions with real money on the line. Simply put, as a subscriber to Tischendorf Letter for several years, Olivier has helped me learn the requisite skills to survive in a bear market, where trading psychology and his motto, “Kill your losers” saved me $10,000’s or more. Now I am thriving in the current bull market applying lessons learned including moving average expansion, avoiding stocks with overhead resistance, trading true market leaders, closely monitoring my equity curve and more. Thank you again Olivier for an amazing service, your teachings have been an essential element in my ability to become a full-time trader.
Happy Trading,
Jeff Roark
United States
For more Member Testimonials check the Testimonial Section
➜ http://www.tischendorf.com/testimonials
Profit from 25+ years of trading experience. Get early exposure to leading stocks!
➜ Tischendorf Letter Premium
Source: http://www.tischendorf.com/2024/03/10/testimonial-tischendorf-letter-premium-2
{ Comments on this entry are closed }