Here’s a new trade idea I think has the potential to develop into a new mega trend for years to come. I have strong opinions but I am not an economist. So no matter what, I always stick to what the charts tell me to do. That being said I believe interest rates are artificially suppressed and will ultimately lead to huge problems with pension funds as they can’t generate the kind of returns they were banking on – no pun intended. This also might explain the runaway move in the stock market as this is one of the few places left to generate decent returns.
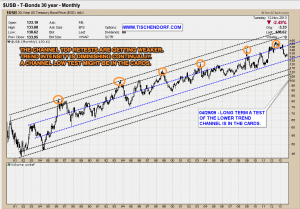
Timing is a very difficult issue, but I see the first signs of a rising interest rates trend shaping up. The trend intensity with 30 year T-Bonds has been continually diminishing. As you can see in the chart the ‘tops are getting weaker’ i.e. the topping processes initially took place at the top or upper boundary of the channel. The last intermediate tops were much weaker on a relative basis. This is not a trend reversal as of yet but is indicative of at least some sort of exhaustion. Trend intensity is simply diminishing. Over time I would expect a test of the lower boundary of the trend channel. Right now it looks as if the chart might be on the verge of rolling over.
Click chart to maximize:
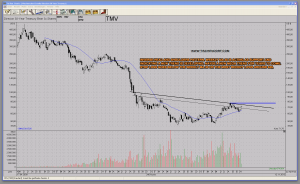
One way to play this potential supertrend in the making are leveraged ETFs like TBT and TMV. Trading leveraged ETFs has significant downside as they are not the best way for a buy and hold approach, but if the initial timing is pretty good and a new trend develops, I think the leverage should make up for value decay inherent to those instruments. In any case, I bought an initial position in TMV- 3x Treasury Bear ETF as it is easy to define a place where to put in one’s stop loss. In the case of TMV the weekly MA 30 is acting as support and is indicating a new trend might be shaping up as the MA is now trending up. The stop loss goes either below the weekly MA 30 or below the most recent lows around 62$ – 63$. The overall pattern is displaying an inverse head and shoulders pattern in the making. The right shoulder is about to be completed soon if my technical analysis assumption is correct.
Click chart to maximize:
Vision without action is a daydream. Action without vision is a nightmare. – Japanese Proverb
Don’t wait. The time will never be just right. – Napoleon Hill
Twitter: https://twitter.com/tischendorf
Investing in your education always pays. Learn how to read chart patterns like a pro! Tischendorf Letter Premium: https://members.tischendorf.com


{ 1 trackback }
Comments on this entry are closed.