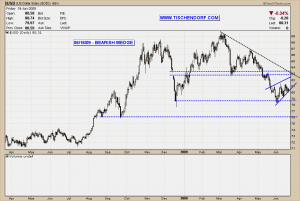
An important aspect in Technical Analysis is the concept of different elements pointing towards the same outcome. I often label price levels on my public list charts as confluence of support or resistance areas. The more different elements there are the higher the odds of a specific outcome. The USD$ daily chart I’ve updated this weekend is a good example to exemplify this concept.
Up-to-date USD Dollar Chart on my public list.
The chart offers 4 clearly visible different elements that tell me the USD$ will hit multiple resistance soon. As this is confluence of resistance it is very likely resistance will hold and turn back down prices. The 4 elements that are easily discernible are the following ones:
- A bearish wedge chart pattern
- A horizontal trendline
- A down-sloping trendline
- The gap in mid-December
Will the US Dollar crash and burn now that the technicals suggest weakness ahead? There is no way to tell. Keep in mind trading is a numbers game. If you can identify areas with a high probability outcome you simply increase odds a trade will be successful.
Different TA elements combined increase your odds.
Enjoy your weekend!

{ 1 trackback }
Comments on this entry are closed.