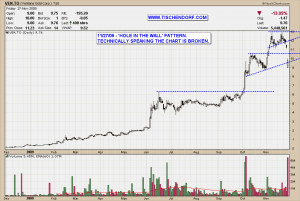
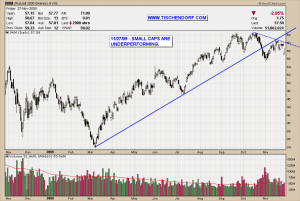
Going through my charts I see lots of technical damage. Plenty of charts show ‘Hole in the Wall’ patterns. I’ve written about this phenomenon before. It is a gap down that comes after a long uptrend and has the potential to end the uptrend. Keep in mind a Trend Change doesn’t necessarily mean we will automatically switch to a downtrend. A trend change could simply mean the markets are about to enter a sideways trend.
That said, two charts displaying significant technical damage and weakness are VEN.TO – Ventana Gold and IWM – iShares Russell 2000 Index Fund. VEN.TO shows a classic hole in the wall pattern whereas IWM just displays extreme weakness of small caps. IWM also shows a gap down which could be interpreted as a ‘Hole in the Wall’ but the pattern is not that clear.
I’ve written lots of good things about VEN.TO in the past. You can use the website search function to review all articles related to VEN.TO. I think odds the stock will get bought out at a higher price are still rather high. But for now the legal stuff needs to be dealt with until it can happen.
I have one rule I will never break no matter what happens. The rule goes like this: Never ever trade against the charts. Technically speaking Gold is overbought. VEN.TO’s upside momentum is broken. I think it is time to move on and find new opportunities. By the way that’s what I have been mentally preparing for over the last 4 weeks.
I have been recharging my batteries and am now emotionally detached and open for new stock ideas. That’s the purpose of taking a break and going to cash every once in a while. The markets look vulnerable so next week will be telling. This is not the time to be a hero.
Up-to-date VEN.TO – Ventana Gold Chart on my public list.
Up-to-date IWM – iShares Russell 2000 Index.
Have a great evening!
Always listen to the charts.


{ 4 trackbacks }
Comments on this entry are closed.