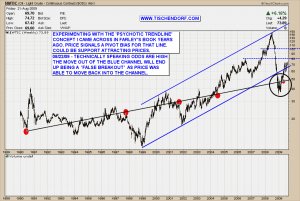
Tonight I’ll talk about the weekly Light Crude Oil chart I updated on my public list. I am starting to think we might have witnessed a false breakout to the downside. I will write about the concept of failed patterns in more detail at some later point in time. Failed patterns are probably the most powerful patterns technical analysis provides.
Back to the Light Crude Oil chart. Price broke down out of the blue channel and is now trading back within that channel. The expected outcome would have been a so-called ‘Kiss of Death’ where price retests the lower trendline but is rejected and turns back down resuming its initial move to the downside. In my book this doesn’t look like a ‘Kiss of Death’ anymore as price has been chugging along the trendline for too long and additionally has been trading mostly within the channel.
I don’t know what will happen and I don’t care. I just wanted to outline a possible outcome. The way I see it odds have increased for a continued up move for light crude oil. The more so if price can move higher soon. That would increase the number of traders trapped on the wrong side of the trade.
If price can move up a bit more from these levels the usual round number routine might kick in. Round numbers and congestion zones at times can act as powerful magnets. From a psychological standpoint the number 100 is one of the most important round numbers attracting prices. So the 100 USD$ mark could very well act as a price target.
Up-to-date Weekly Oil Chart on my public list.
Administrative note:
Website updates are done. Everything is back to normal.
Have a great weekend!

{ 5 trackbacks }
Comments on this entry are closed.