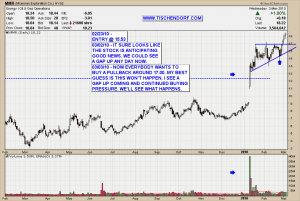
A quick post on the technical chart setup with MMR – McMoRan Exploration. The ascending triangle was implying a breakout to the upside with MMR was imminent. We got our break-out. Now everybody wants to own some shares as the pattern is getting more obvious. My gut feeling tells me people are literally lining up to buy a pullback to the 17.00 USD$ area. My best guess is it won’t happen. No matter what happens the pattern pressure of the bullish ascending triangle is now pushing prices upward. A pullback looks like an excellent way to enter the stock. Time will tell if it materializes.
Up-to-date MMR – McMoRan Exploration chart on my public list.
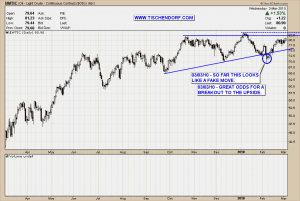
I also updated the daily WTIC Light Crude Oil chart. Odds of a break-out to the upside seem to be increasing by the day. This bodes well for energy stocks in the Oil and Natural Gas space. The bullish ascending triangle implies a breakout to the upside with a 100 USD$ price target for Oil.
Up-to-date Light Crude Oil chart on my public list.
I think I did all right but I want to improve. – Sidney Crosby
Have a great evening!


{ 1 trackback }
Comments on this entry are closed.