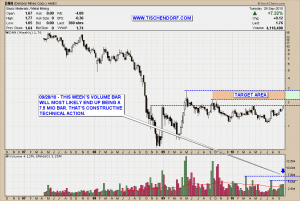
Here’s a few additional technical analysis thoughts on DNN / DML.TO – Denison Mines as the weekly chart is not part of my public list. That being said it’s always a good idea to check weekly charts of stocks you plan to buy. The most important aspect of checking the weekly chart is the fact you’ll have a much better idea of the ‘big picture’. Put another way, it’s easier to filter out the noise and focus on where the chart is coming from and where it is most likely headed to.
Click the chart to maximize.
As you can see, price is about to pierce the dotted line I drew into the chart. I would consider this line to be a critical price level. It somewhat looks like the neckline of a complex inverted head and shoulders pattern. If price continues to move up, a 2.50 price target looks reasonable. More importantly though is the fact volume is confirming the price movement to the upside. From a technical analysis perspective, price going up while being accompanied by surging volume, has to be considered constructive action. That is, unless it is some blow-off type volume, which obviously isn’t the case right now.
What is even more important though, is to monitor so-called ‘other time frame market participants’. In this particular case, traders basing their buy decision on weekly charts will most likely get a buy signal with this week’s candle. That would simply mean additional buying kicking in. Let’s see what happens.
L’homme n’est que poussière… C’est dire l’importance du plumeau. – Alexandre Vialatte
My public list with all my charts can be viewed here:
http://stockcharts.com/def/servlet/Favorites.CServlet?obj=ID2791469
Buenas noches!

{ 3 trackbacks }
Comments on this entry are closed.