With today’s down move in the precious metals sector a much needed consolidation has started. Signs to be extremely cautious were abundant. With the US Dollar having reached its ABC down move target it was getting very risky to chase the precious metals to the upside.
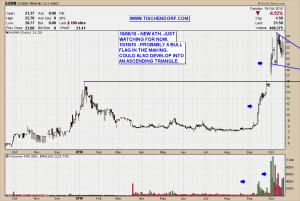
Now is the time to closely watch the best pm stocks and monitor their consolidation patterns. So far, AUMN – Golden Minerals is consolidating in an orderly fashion. We are probably witnessing a bullish flag in the making. As indicated in the annotated chart, the pattern could easily develop into an ascending triangle which would also be very constructive technical action.
Up-to-date AUMN- Golden Minerals chart on my public list.
So what if this is the start of a bigger correction in the precious metals sector? Here’s a few things to keep in mind:
- Watch the leaders. They will be the first ones to break out to the upside.
- Horizontal and ascending consolidation patterns are best.
- Ever decreasing volume within consolidation patterns is bullish.
- It is typically rather difficult to enter strong momentum stocks.
- When time is up a stock needs to move. Drifting along endlessly is a bad sign.
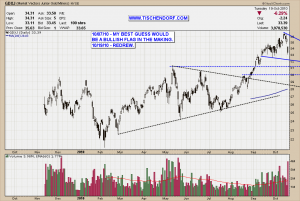
A few potential red flags and possible warning signs are to be found in GDXJ – Gold Juniors ETF and GLD – Gold ETF. I redrew the bullish flag with GDXJ. The pattern is still valid but you will notice volume has increased within the potential flag pattern. As opposed to AUMN – Golden Minerals where volume has been ever decreasing, this has to be considered less bullish.
Up-to-date GDXJ Junior Gold Miner ETF chart on my public list.
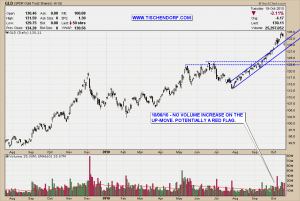
Another potential warning sign can be found looking at the chart of GLD. What we are witnessing here is a classic ‘price falling back into the pattern’ situation. Considering the fact the advance was extremely steep this was to be expected. For now I wouldn’t be overly concerned. Still, I wanted to mention this price behaviour.
Up-to-date GLD – Gold ETF chart on my public list.
The next two weeks will most likely give us enough clues as what to expect next. Be patient. Be emotionally detached and closely watch how the strongest stocks consolidate in order to better gauge their respective strength. I’ll be adding a few more mining stocks to my public list soon.
So many traders get exited about being right in the market but the trick is to be profitable even though you are often wrong. – Dan Zanger
My public list with all my charts can be viewed here:
http://stockcharts.com/def/servlet/Favorites.CServlet?obj=ID2791469
Buenas noches!


{ 1 trackback }
Comments on this entry are closed.