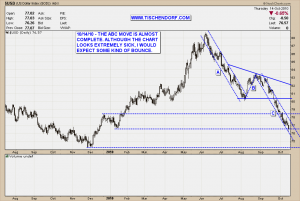
Just updated the daily US Dollar chart on my public list. The most obvious pattern emerging is the ABC move to the downside. The price target of that move is located somewhere around 0.75. This is pretty close to the lows printed in December last year. Overall the US$ chart looks sick and technically speaking the long-term outlook for the US Dollar is bearish.
With the overall bearish technical picture in mind, I wouldn’t expect much more than a dead cat bounce. It is impossible to know though if a bounce will indeed materialize and extremely tough to quantify the magnitude of the bounce. My point is, I do expect some kind of bounce rather sooner than later. From a technical perspective odds we will witness some kind of counter trend reaction are rather high. This will impact the precious metal charts.
Up-to-date Daily US Dollar Chart on my public list.
Up-to-date Monthly US Dollar Chart on my public list.
Uranium stocks and DNN – Denison Mines in particular did rather well today. I like the Uranium trade idea because it is not a crowded trade. This significantly reduces the odds of Uranium being impacted by a potential US Dollar bounce.
Opportunities multiply as they are seized. – Sun Tzu
My public list with all my charts can be viewed here:
http://stockcharts.com/def/servlet/Favorites.CServlet?obj=ID2791469
Buenas noches!

{ 2 trackbacks }
Comments on this entry are closed.