So much for my ‘neutral, slightly bearish’ bias a few days ago. Today’s incredible washout was nothing short of spectacular. I opted for the term ‘washout’ in the title of the post because lots of stocks recouped most of their intraday losses and recovered very well. So, again we have a situation where lots of stocks look like they put in reversal candles, which is the bullish point of view. On the other hand the Personality of the Market now clearly has shifted. This kind of fear, increased volatility and selling pressure will make it very hard for the bulls. Overhead resistance has increased and those who have stayed long will probably be looking to ‘get out even’.
These are very important times when it comes to analyzing and looking for the next opportunities. As a general rule you want to look for the following characteristics:
- Does a stock refuse to go lower?
- How well was a stock or sector able to hold up?
- How much of the intraday losses was a stock able to recoup?
- Did a stock shake out lots of traders by means of a long tail to the downside?
In plain English: What kind of resilience did a stock display? Is it displaying relative strength within a hugely negative environment? The last question is somewhat tricky. Putting in a long tail has washed out traders but the lows might be retested. Not putting in a long tail means that traders didn’t get hurt but putting in a long tail might have only be delayed. If the market can rebuild pressure to the upside at some point in time those stocks that have displayed the best relative strength are likely to be new leaders and outperforming stocks.
Three stocks displayed great strength today:
- PPO – Polypore International – Chemicals Sector Overview Chart
- TIE – Titanium Metals – Exotic Metals Sector Overview Chart
- KIV.V – Kivalliq Energy – Uranium Sector Overview Chart
The first two were up around 15% and KIV.V was up 7% while almost every Uranium stock was down. It is way too early to speak of a Uranium price turnaround. Today would have been THE day to get rid of weak holders though. KIV.V didn’t hurt traders. My best guess is it will explode to the upside at the slightest hint of buying interest in the Uranium sector. KIV.V – Kivalliq Energy is simply the strongest Uranium stock around.
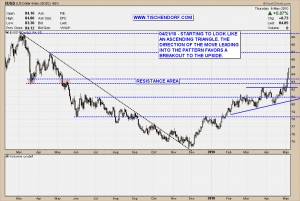
One last thing that comes to mind. Don’t waste your time thinking too much about what exactly caused today’s price action. Instead stay balanced and focused. Listen to the charts. They tell the truth. Talking about truth, the short-term US Dollar chart was clearly signaling strength and a US Dollar break out to the upside of the ascending triangle was to be expected. So no surprise here:
Up-to-date US Dollar chart on my public list.
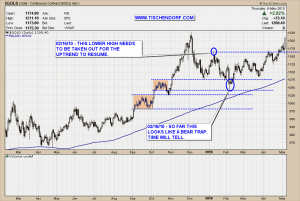
Gold was extremely strong as well. The Gold chart was clearly indicating strength as well. Especially when looking at the various currencies priced in gold. The price of Gold in US Dollars is now trading very closely to its all time high. This is the only true bull market around. There is no overhead resistance. Nobody has the urge to sell in order to get back even. Technically speaking this is the best environment for explosive and parabolic moves to the upside. We will have to see how things develop and if the miners decide to catch up. So far, performance wise the miner ETFs GDX and GDXJ are still lagging the price performance of gold.
Up-to-date US$ Gold Price chart on my public list.
A great time to again think about the deeper meaning of the following quotes and market adages:
Great traders offer no excuses.
The markets are what they are.
Anything can happen.
My public list with all my charts can be viewed here:
http://stockcharts.com/def/servlet/Favorites.CServlet?obj=ID2791469
Buenas noches.

