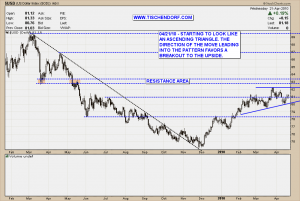
While I am at it another quick post about a development I noticed going through my watch list tonight. Lots of gold bugs think the US Dollar is doomed, is hitting huge resistance and is about to top out. Technically speaking though the US Dollar chart is displaying short-term strength. The chart pattern at hand looks like a bullish ascending triangle. Technicals favor odds of a break out to the upside as the trend leading into the pattern was up. In Technical Analysis the resumption of the trend leading into a price pattern is the outcome with the highest probability. Also keep in mind the US Dollar moving up would hurt lots of traders. Stay open-minded and factor in all possible outcomes. Especially the unexpected and most hated US Dollar scenarios.
That being said the Euro is starting to look really weak. So far it hasn’t managed to bounce from oversold levels. Oil has not broken out yet either. It remains to be seen if it can reach that 100 Us Dollar target. Lots of people consider oil prices moving up as confirmation of Inflation kicking in. Interesting times ahead to say the least.
Up-to-date US Dollar chart on my public list.
If you want to know how rich you really are, find out what would be left of you tomorrow if you should lose every dollar you own tonight. – William J. H. Boetcker
My public list with all my charts can be viewed here:
http://stockcharts.com/def/servlet/Favorites.CServlet?obj=ID2791469
Have a great evening!

{ 2 trackbacks }
Comments on this entry are closed.