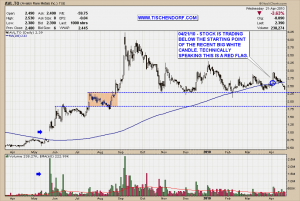
Avalon Rare Metals – AVL.TO a stock I still consider a leading stock in the REE Rare Earth realm has dipped below its 200 day moving average. The fact AVL.TO – Avalon Rare Metals gave back all the recent gains and is now trading below the price level the recent big white candle started at is cause for concern. Technically speaking this raises a red flag. This is short-term. In the long run this could possibly turn out to be noise. Still, if you look at the charts of the leading Rare Earth stocks it seems the stocks that will turn out to be the true winners are more likely to be RES.V – Rare Element Resources and QUC.V – Quest Uranium.
Up-to-date AVL.TO – Avalon Rare Metals chart on my public list.
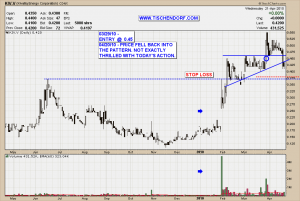
Interestingly KIV.V – Kivalliq Energy shows a similar pattern. It has retraced the price advance of its big white thrusting candle as well. The main difference though is that with KIV.V we are much earlier in the trend. So these kind of retracements tend to be less significant and should be less worrisome. If the markets start to top out though, overall selling pressure will invalidate the great majority of buying set-ups. Of course news always trumps the charts. Still, KIV.V – Kivalliq Energy should show strength soon otherwise it will inflict too much immediate pain on traders and trapped traders tend to sell first and ask questions later.
Up-to-date KIV.V – Kivalliq Energy chart on my public list.
When I say ‘we are much earlier in the trend’ I am referring to the gap ups printed on high volume which mark turning points in the charts. These gap ups followed by thrusting moves are very often the start of new trends. Compare the charts and you will see that with KIV.V – Kivalliq Energy big price moves most likely have not ended but are still about to materialize. Sometimes you get stopped out before a stock can develop its full technical potential. That’s simply part of trading. Trading is not about being perfect. We’ll see what happens.
Monitoring the Uranium Sector Overview Chart will give us a clue if the sector as a whole can start to move up and buying pressure can develop or if buying Uranium stocks is fighting the tape. U.TO – Uranium Participation will be key. It’s part of the other Uranium Sector Overview Chart I maintain on my public list.
Perfectionism is just another form of self-pity and low esteem. Throw it aside.
My public list with all my charts can be viewed here:
http://stockcharts.com/def/servlet/Favorites.CServlet?obj=ID2791469
Have a great evening!


{ 3 trackbacks }
Comments on this entry are closed.