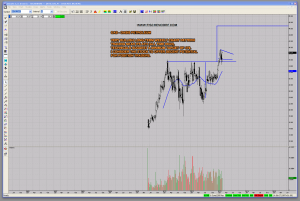
Quick chart post with a trade idea I consider to offer good potential. The way I see it, the chart is well suited for true position traders. OAS – Oasis Petroleum has broken out above long-term horizontal resistance and is now consolidating and building out a bullish flag pattern. A conservative price target looks to be 47$. The technicals ultimately imply an even higher price target. The stock shouldn’t dip back below the recent swing low at 34.53. A stop loss below that level offers protection if price action invalidates my technical analysis assumptions. I have a position.
Real movements do not end the day they start. – Jesse Livermore
Charts: http://stockcharts.com/public/1109839/tenpp
