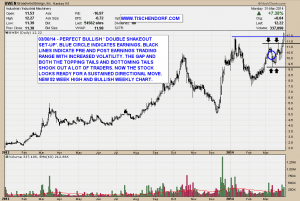
Updated chart and thoughts for BWEN – Broadwind Energy after what I deem to be a beautiful earnings shakeout similar to the one with MXWL – Maxwell Technologies which I described in my latest Tischendorf Letter Interview.
I highlighted BWEN – Broadwind Energy Bullish Inverse Head And Shoulders Pattern a while back. The pattern has now developed even more bullish pattern pressure. Interestingly it is now offering additional pressure. The reason is a psychological one. As outlined in my chart annotations we have witnessed a multiple shakeout pre and post earnings. First the topping tail shook out traders. Then the earnings gap shook out another batch of traders. Then the bottoming tails took care of everybody else. This created a high volatility trading range which I drew into the chart using black lines. BWEN then proceeded to break out of that trading range and now has also taken out the blue line resistance thus printing a new 52 week high.
The weekly chart is either displaying an inverse head and shoulders pattern or an ascending triangle. Some traders also call it a ‘running consolidation’ or ‘ascending base’. How you name the pattern doesn’t matter. The important thing to keep in mind is the psychological implication. Traders are eager to buy into the stock and therefore the stock isn’t able to put in a horizontal resistance line as each time that level is hit buyers are willing to pay up. The pattern is difficult to grasp as it is constantly morphing and behaving much like a moving target. A strict and rigid set of rules won’t help you understand it either. Furthermore many traders think this is a bearish wedge pattern. I disagree as we are coming out of a long base and the overall pattern pressure is very bullish. Additionally a bearish wedge should ideally appear after a prolonged downtrend. That is not the case here.
As usual, no matter what you might think or how good you deem your analysis to be, using a stop loss makes sure a strong opinion won’t hurt you in case the technical situation turns sour. There is no doubt that increasing volume coming into the stock would help validate the set-up. So one thing to keep an eye on is big volume bars confirming rising prices.
Click on the chart to enlarge:
The market’s sole job is to confuse us. Always look for confirming signs. Be in a hurry to sell a loss and reluctant to sell a profit. Let your stops make your decisions for you. – Brad Koteshwar
Twitter: https://twitter.com/Tischendorf
Investing in your education always pays. Learn how to read chart patterns like a pro! Tischendorf Letter Premium: https://members.tischendorf.com
