Welcome to 2011! I hope everyone enjoyed the holiday break. No need to rush things, quite a few traders will continue to stay away from the markets until next week. On to the charts.
Canadian markets were closed today so I don’t have that much to say. Then again I couldn’t have asked for a better start into 2011 as LNG – Cheniere Energy, one of my US listed portfolio positions shot out of the gate today. So I’ll just provide a quick technical analysis update.
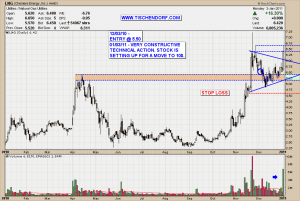
Up-to-date LNG – Cheniere Energy chart on my public list.
As you can see, volume coming into the stock today was absolutely massive. Now that might be due to some serious sector rotation going on i.e. traders moving money out of commodities that have run up big time in 2010 and putting the proceeds into beaten down commodities like Natural Gas with Turnaround Potential. After all, Natural Gas has been the worst performer in 2010 so that might explain it. We might also be witnessing the beginning of a massive short squeeze in LNG.
We don’t care. The technical set-up was there. The trade offered rather low risk of getting stopped out and risk was easy to manage. Therefore asking the ‘why exactly did the stock move up’ question is an exercise in futility. Much better questions would be: ‘How can I improve my entries?’ or ‘When do I exit?’ To make a long story short, everything which has to do with the trade execution process and managing the trade once you have put it on.
That being said, volume was massive and has to be considered constructive technical action. The initial thrusting move turned into a consolidation pattern ultimately respecting the 5.00 US$ price area. It is important to understand most of the time support should be viewed as a price area as opposed to being a clearly defined price level. Today’s move is resuming the trend of the thrusting move leading into the consolidation pattern. Now, if you think that this is something I have already stated quite a few times in the past, you are perfectly right. This price behavior is always the same because human psychology doesn’t change.
The overall pattern is now a bullish ascending pattern with an obvious 10 US$ price target for LNG. The target becomes much more obvious if you review my LNG Weekly Technical Analysis. The price and volume action now confirm my trade entry rationale. Whenever that happens, or put another way, when a stock is acting right, I switch to ‘patience mode’. This looks like the beginning of a new trend. There is no way to tell where this trend will end. That’s why I patiently hold on to my shares until the price action tells me to do otherwise. My job is now to monitor the stock’s action and to raise my stop loss once obvious price pivots have been put in place.
When you’re right, have the patience to be right big. When you’re wrong, have the discipline to be wrong small.
My public list with all my charts can be viewed here:
http://stockcharts.com/def/servlet/Favorites.CServlet?obj=ID2791469
Buenas noches!
