As everybody should be aware by now, I am not in the business of picking bottoms or tops. This is a losing proposition. What I am willing to do though, is to have strong opinions based on things that are not price related. Call it fundamentals, sentiment analysis, psychological factors, whatever. Then, my job is to patiently wait for price to confirm my opinions. Put another way:
“Don’t trade your opinions.”
As I mentioned above, it’s OK to have strong opinions, but your buy and sell decisions should be based on price action exclusively. That being said, what kind of confirmation did we get today that leads me to think we might be very close to a bottom or have already witnessed a price bottom in natural gas? Here’s a few observations:
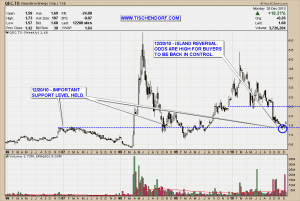
- QEC.TO – Questerre Energy: The company announced a stock buy-back program. The daily chart shows a series of gap downs which hints at exhaustion to the downside. Today we gapped up and the weekly chart has now printed a bullish island reversal. Odds are extremely high everybody who wanted out has now indeed sold their position. To use a technical term: “Buyers are now back in control.”
Click on the chart to maximize.
- CHK – Chesapeake Energy: “In a regulatory filing he made after the market closed on Friday, Icahn disclosed that he had accumulated 38.6 million shares of Chesapeake Energy (CHK), a 5.8% stake, and has already been talking to management. Beyond saying the shares are undervalued, Icahn didn’t explain his interest in the company.” Smart money is obviously starting to buy into natural gas stocks. Do what the smart money does. Not what they ‘say’ or ‘think’.
- LNG – Cheniere Energy: LNG has once again respected the 5$ support level. We are still trading within a higher lows scenario.Today’s action is bullish as it indicates buyers are now most likely back in control. I would like to see follow through tomorrow with a close above 5.70 – 5.75. That would convince me buyers are indeed back in control. That would also increase the odds for a white weekly candle to be printed. Once we print a convincing white weekly candle my best guess is we will be off to the races. We are not there yet. But it sure feels like we are getting closer. Patience.
The charts that are part of my natural gas sector overview chart look like a screaming buy here. Some have started to break out. Some are on the verge of breaking out. Here’s the overview including: FCG – Natural Gas ETF, CHK – Chesapeake Energy, GLNG – Golar LNG, LNG – Cheniere Energy, CLNE – Clean Energy Fuels, QEC.TO – Questerre Energy.
Again, the most hated commodity right now is Natural Gas. But now, even the worst under performers like QEC.TO are flashing technical buy signals. CHK, a natural gas bellwether is starting to break out to the upside and is able to attract smart money. Therefore getting long exposure to natural gas stocks has to be considered a low risk proposition. I put my money where my mouth is. That’s why LNG – Cheniere Energy found its way into my portfolio. Right now this can hardly be considered a crowded trade. More price confirmation will make this Natural Gas speculation a sound one as opposed to simply being wishful thinking or picking a bottom.
The desire to maximize the number of winning trades or minimize the number of losing trades works against the trader. The success rate of trades is the least important performance statistic and may even be inversely related to performance. – William Eckhardt
My public list with all my charts can be viewed here:
http://stockcharts.com/def/servlet/Favorites.CServlet?obj=ID2791469
Buenas noches!

{ 8 trackbacks }
Comments on this entry are closed.