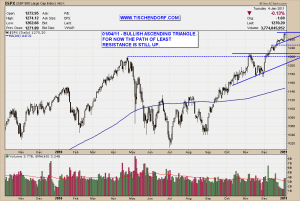
The S&P 500 looks tired here, still the path of least resistance is up. That could change anytime but due to the technical set-up we could witness another move to the upside. A short squeeze hurting those putting on short positions too early cannot be ruled out. In any case if you put on new long positions this is a good time to be extremely selective or to stand aside and think about protecting existing positions with tight stops.
Up-to-date S&P 500 chart on my public list.
Today I updated the S&P 500 chart and as you can see we have a small bullish ascending triangle sitting on top of a larger bullish ascending triangle. The patterns getting smaller and occurring in rapid succession could indeed be interpreted as trend acceleration. As I mentioned above, the S&P 500 could easily move higher and inflict further pain on short sellers.
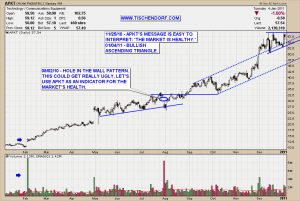
In addition to monitoring the indices I use APKT – Acme Packet one of the leading Mobile Internet Stocks and a typical ‘Salmon Stock’ as a way to measure and gauge the market’s health. Like the S&P 500, APKT is trading within a newly formed ascending triangle.
Up-to-date APKT – Acme Packet chart on my public list.
What is interesting to note here is the fact APKT has broken out above the channel I drew into the chart. It will be decision time soon. If APKT breaks down it will be ‘falling back into a pattern’ which from a purely technical perspective has the potential to lead to further weakness. Falling back into a pattern is often a sign for a failed or false move. On the other hand, if we see a break to the upside from a purely psychological perspective it would be comparable to a situation where the stock is seeking separation from the channel. Significant separation would coincide with a potential short squeeze in the indices. We will know soon.
Never have profit targets. – Trend following mantra
My public list with all my charts can be viewed here:
http://stockcharts.com/def/servlet/Favorites.CServlet?obj=ID2791469
Buenas noches!


{ 4 trackbacks }
Comments on this entry are closed.