It looks like nothing can stop this freight train. In my last S&P 500 Chart Analysis I said the path of least resistance was still up. The S&P 500 then kept on marching higher. There is not much else I have to say. Unless the charts tell you otherwise you have to be a fool to fight this powerful uptrend. The path of least resistance is still up until proven otherwise. Again, if you cannot ‘understand why’ this is happening or whatever rationalization you may want to go for, it doesn’t matter. Standing aside and missing out on a move is fine. This is something that happens all the time. But being short, being wrong and staying wrong is unforgivable. The lesson to be learned is the following:
“Don’t trade your opinions. Base your trading decisions on the charts.”
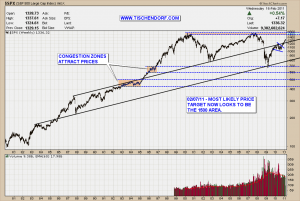
Here is a weekly chart of the S&P 500. I recently updated the chart and drew in a bullish flag pattern. We have a technical situation I have described quite extensively in the past: 1. A thrusting move. 2. A consolidation pattern. 3. Resumption of the trend leading into the pattern. The technical price target for the S&P 500 now most likely looks to be the 1500 price zone. There are several factors suggesting we are headed towards that price area:
- The ABC pattern suggest a 1500 price target.
- The previous highs are significant pivot points starting to attract price.
- The importance of the number ‘3’ in technical analysis. Price likes to test levels three times.
As far as the importance of the number 3 in TA is concerned, think ‘ABC moves’ which are also often called ‘1-2-3 moves’. Another classic trading pattern that comes to mind is ‘triple top’. An adage that comes to mind would be ‘three times is a charm’, as price usually touches or tests a level twice and then breaks out or finally gets rejected after doing so the third time.
Up-to-date S&P 500 weekly chart on my public list.
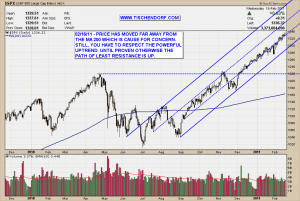
Up-to-date S&P 500 daily chart on my public list.
Click on the charts to enlarge.
The daily chart shows the powerful and relentless nature of the recent price rally. The S&P 500 seems to be trading within a parallel price channel, at least that’s what I am starting to see. Unless the chart starts conveying a different message you have to understand and respect the trend. As I’ve mentioned above, there’s only two things you want to do in such a situation, either be long or stand aside.
On to a quick review of my portfolio positions:
DNN / DML.TO – Denison Mines: Still one of my favourite picks for this year. The stock is in a powerful uptrend. It looks like the stock may need some time to digest the massive price advance. Overall the Uranium sector still looks extremely bullish going forward.
UEX.TO – UEX Corp: Not as strong as DNN. Patience.
TMB.TO – Tembec: Stock needs more time. I think odds are high we will see 10$ for TMB.TO during the course of the year.
CNL.TO – Continental Gold: The updated annotation on my public list reads: The stock is reasserting its strength. Today excellent drill results were published. They confirm the high gold grade nature of Continental Gold’s Colombian properties. I added a bit to my position today.
LNG – Cheniere Energy: So far this looks like a slow motion short squeeze with LNG. The stock is seemingly unstoppable and simply grinding its way higher. We haven’t seen anything like a buying panic yet. Still no painful gap up for the shorts. No signs of capitulation. I am smelling blood here. Longs that bought at lower prices risk giving back profits. That’s a risk I am willing to take. Shorts are risking their trading career if they are wrong. That’s a risk I would not be willing to take. I added a bit to my position today.
The minute you become attracted to your money or let the money dominate you emotionally you lose sight of what is going on in the markets. – Dan Zanger
My public list with all my charts can be viewed here:
http://stockcharts.com/def/servlet/Favorites.CServlet?obj=ID2791469
Buenas noches!


{ 3 trackbacks }
Comments on this entry are closed.