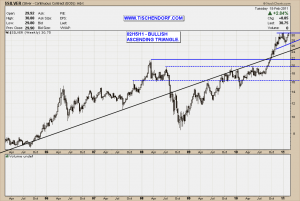
This is basically meant as a follow-up to yesterday’s post. The picture within the precious metals is indeed very mixed. The bearish flag pattern in GLD I talked about yesterday is still valid. On the other hand we have a very bullish technical set-up in silver. The weekly chart is forming an ascending triangle which is a common bullish continuation chart pattern.
Up-to-date Weekly Silver chart on my public list.
My preferred scenario would be a small pullback in silver to build more pressure and forcing gold down a bit more to get rid of more holders. Then reversing course and moving higher. Let’s see what happens.
Now how can one reconcile the mixed signals Silver and Gold are sending? The best way to avoid getting trapped, is not to force trades. That’s why waiting for the charts to send clear and strong signals is paramount. Long-term readers of my website know I have decent exposure to physical gold and silver bullion coins. That’s the core position I am riding in this precious metals bull market. As far as trading is concerned, I don’t fear ‘missing out’. I patiently wait for great entries. No fear, no greed. I don’t remember how often I’ve said this before, but it is always worth repeating: “There is never a shortage of opportunities in the markets.” If you believe otherwise you’ve probably not been around very long.
I’ve spent most part of the day adding new sector overview charts and I will add additional stocks to my public list soon. In the meantime you can check the following new charts:
- Batteries – Sector Overview Chart
- China Internet – Sector Overview Chart
- Phosphate – Sector Overview Chart
- Transportation – Sector Overview Chart
- Zinc – Sector Overview Chart
Here’s a post with my Monthly Silver Chart Analysis.
A mine is a hole in the ground with a liar at the top. – Mark Twain
My public list with all my charts can be viewed here:
http://stockcharts.com/def/servlet/Favorites.CServlet?obj=ID2791469
Buenas noches!
