This week I plan to post about the different sectors I am watching. What exactly I am looking at and which stocks I think have great odds of being high potential trades. The sectors I intend to write about are: Gold, Lithium, Chinese education stocks, Rare Earth Elementss, Silver and Energy. Might take longer than 1 week and I might change my mind but for now this is how I intend to proceed. Let’s start with Gold:
I am bullish gold and although I expect higher long term price targets I don’t know where gold is going. As I am not in the predicting business I can’t tell where gold will trade in 3 months, 6 months or next year. Nobody can. That said something I can do is to analyse the chart and assess odds for price to move higher or lower and the risk involved in each scenario. Then my job is to adapt to new situations and act accordingly.
- The charts tell me a consolidation could start here – I already started drawing a few possible flags on some of the gold and silver related charts on my public list. If these flags indeed build right now we are somehow stuck in the middle of the road. A flag building around the 1000$ level indicates lots of indecision. This is testing traders’ resolve. No clear-cut conclusion can be drawn as it doesn’t really allow for a decisively bullish or bearish interpretation.
- In a bullish scenario I would expect gold to leave the 1000$ mark behind and create true separation from that level. As much separation as possible would be best as the 1000$ would then be ‘resistance turned into support‘. The more significant the separation the higher the odds support would hold.
- A move lower from here would indicate a retest of the triangle breakout level. It would still allow for a bullish interpretation but overall I would become very cautious in case that scenario develops.
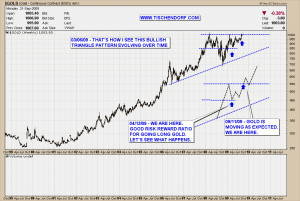
Here is the gold price development I have delineated a while back. I still expect it to evolve like that. The long term price trend is bullish so probability favours higher prices. Let’s see what happens:
Always up-to-date GOLD Index chart on my public list.
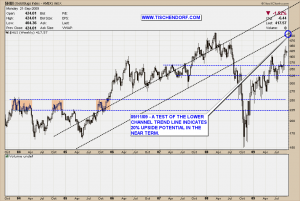
Here is the HUI – Gold Bugs Index chart. The way I see it gold stocks offer lots of potential to the upside. ANI.V – Animas Resources and BOW.V – Bowmore Exploration two gold mining exploration stocks doing business in Mexico in my portfolio are a way to play this potential scenario.
Always up-to-date HUI chart on my public list.
Have a great evening!


{ 2 trackbacks }
Comments on this entry are closed.