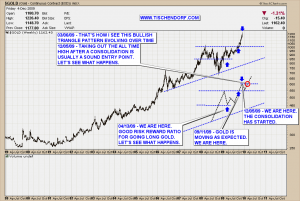
Gold has now started a consolidation. I have adjusted and annotated my public chart accordingly. The path gold has traveled so far is pretty much what I outlined in Gold’s Future Outlook although I didn’t expect such strength during the separation move away from the 1.000 USD$ level. This has solidified the 1.000 level as support and former resistance has now become support, one of the most important concepts in technical analysis.
Odds are very high now the 1.000 level will hold. I wouldn’t be surprised to see a consolidation which doesn’t actually retest these levels. It would all come down to the market not letting new market participants getting in easily. I am going to watch for reversal patterns i.e. candles with long reversal tails literally ‘hammering’ out support. Hence the term ‘hammer’ Japanese candle stick analysis uses.
Friday’s big black candle on huge volume is frightening to say the least. Then again, up trends are characterized by prices slowly and continually moving up. That’s what we have seen during this gold bull market move. Counter trend corrections tend to be vicious and fast. The first candle on Friday fits into that category although I don’t like the huge volume in GLD. Here’s a quote from my Quotes Section that describes how counter trend moves during bull markets are supposed to look like:
Fundamental facts of primary trends and their corrections:
Movements in the primary direction tend to be extended and laborious, while secondary movements against the primary trend tend to be sudden, often violent, and short-lived.
One more thing to keep in mind when it comes to candlestick theory is that thrusting moves typically occur in a 3, 5 or 8 candle series. When it comes to big candles moving in the same direction, 3 big candles appear quite often. That said, I expect the gold market to give us clues where to expect a bottom sometime next week. Personally I would prefer to see a 2 week consolidation, but I am not sure we will get that. Looking at the charts I would expect a retest of the 1050 level. Let’s see what happens.
Up-to-date Small format Gold Chart on my public list.
Up-to-date Big format Gold Chart on my public list.
Notice the red circle in the chart? That would be a low stress entry point. No headaches. You could just wait until the consolidation is over and reenter gold when the old highs are taken out to the upside. The disadvantage is you have to pay more. The advantage is you don’t end up holding to a losing position in case the original analysis turns out to be wrong.
A trader should have no opinion. The stronger your opinion, the harder it is to get out of a losing position. – Paul Rotter
Have a great weekend!

{ 5 trackbacks }
Comments on this entry are closed.