The S&P 500 chart technicals keep deteriorating. Still, I typically don’t short and prefer to stand aside when going long doesn’t look like a good proposition for position traders. Making money on the short side is more difficult as timing errors are usually less forgiving than buying positions in confirmed bull markets. Another thing I consider to be very important is taking breaks, recharging my batteries and significantly reducing stress levels every now and then. After a long run up I simply prefer to clear my mind as opposed to switching positions and keeping exposure to the markets by means of shorting. Peak performance requires taking some time off on a regular basis. Staying 100% focused 24/7 indefinitely is simply not sustainable.
That being said, looking at the charts I think the markets are headed for another move to the downside. The overall trend remains up though. So my job as a trader is to continue to monitor the market’s strength, monitor the willingness of buyers to step in and to watch sellers’ willingness to short the markets.
Up-to-date S&P 500 chart on my public list.
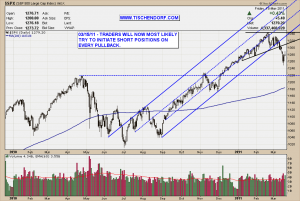
As you can see in the chart above, click to enlarge, the S&P 500 has not only broken down from the parallel price channel but has also broken to the downside of the potentially ascending bullish triangle. Selling pressure has now increased to a point where sellers are now considered to be in control. The only thing you can do if you correctly align your positions with the prevailing trend is to either be short or neutral. I am therefore going to sit on my hands until the market tone changes again. Going long at this point in time would be fighting the trend and would break an important concept successful traders follow: ‘Trading should be effortless.’
The short sellers will now most likely view every pullback as an opportunity to initiate or add to their short positions. The charts will tell us how resilient the market is and what kind of price targets we could reach before the up-trend resumes. For now an obvious price target for the S&P 500 would be the 1220 price area, a level where the chart printed significant price pivots in the past. What once was resistance should now act as support. Technically speaking everything looks like this will end up being an orderly correction within on ongoing bull market. I am not going to be a hero and I am not going to try to find out though. Keep in mind huge corrections start with small pullbacks. It is only with the benefit of hindsight we will be able to tell what this correction will end up developing into.
Be patient and wait. Watch the tape. Filter out the noise and focus on identifying new leaders.
We have to be willing to do nothing if there is nothing good to trade. Work hard when the market is easy but get lazy when the market is tough. – Tyler Bollhorn
My public list with all my charts can be viewed here:
http://stockcharts.com/def/servlet/Favorites.CServlet?obj=ID2791469
Buenas noches!

{ 1 trackback }
Comments on this entry are closed.