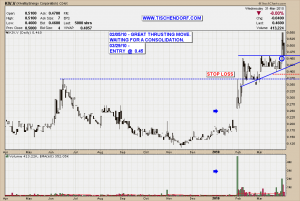
One of my portfolio positions, KIV.V – Kivalliq Energy, pulled back today. Although the pullback didn’t exactly put a smile on my face, so far this is still perfectly bullish action. The breakout level was not breached and volume is significantly lower as opposed to volume during the break out. It is rather obvious the chart should not linger around those levels for too long. If the stock is to embark on a move to much higher prices, buyers who missed the initial breakout will be eager to buy the stock around these levels. The upper boundary of the ascending triangle has now turned into support and offers a second chance for an entry. The next few days will be telling.
Up-to-date KIV.V – Kivalliq Energy chart on my public list.
As you will notice in the chart I have added the Stop Loss I am using. The same applies to my ANO – Anooraq Resources chart. From now on I will indicate stop loss levels and annotate my charts accordingly. When a stock moves up I will raise the stops accordingly and update the chart annotations. My goal is to make the experience for all those who follow my work and have showed their continued support over the years as user friendly as I possibly can. I am always trying to further increase discipline and to put greater emphasis on cutting losses. The most important ingredients of successful trading are risk control and emotional detachment.
No man is worth his salt who is not ready at all times to risk his well-being, to risk his body, to risk his life, in a great cause. -Theodore Roosevelt
My public list with all my charts can be viewed here:
http://stockcharts.com/def/servlet/Favorites.CServlet?obj=ID2791469
Have a great evening!

{ 2 trackbacks }
Comments on this entry are closed.