Markets are not bouncing. As of yet it looks like the preceding decline was not pronounced enough and sellers obviously are not exhausted. The hammer reversal candles that are all over the place have not been invalidated but the longer it takes for the markets to bounce the less likely we’ll eventually see a bounce at these levels. No need to rush things.
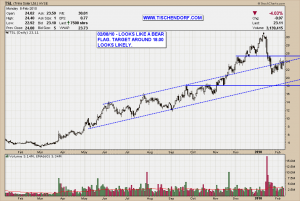
With lots of charts the path of least resistance is now down. A chart that comes to mind and that I’ve annotated accordingly is TSL – Trina Solar. This looks like a clearly defined bear flag. The price target should be in the 18.00 area if the flag is resolved to the downside. TSL is still one of the strongest chart within the Solar Sector so caution is warranted.
Up-to-date TSL – Trina Solar Price Chart on my public list.
If you don’t want to go short in order to make money the current market environment should at least be telling you to be extremely cautious with long positions. Hence my very conservative long exposure I have been writing about for about 3 months. I am still willing to go long a few select stocks but I am certainly not pushing it.
A few things to keep in mind:
- You don’t need to be in the markets all year long to make big money.
- You don’t need to trade every day.
- The big money is made with a few single trades.
- Money comes in bunches.
- A huge part of trading consists of observing, analyzing, sitting on the sidelines and waiting until great opportunities arise.
- There are times to be aggressive and there are times where you should sit on your hands.
Wait for a good one.
Have a great evening!
