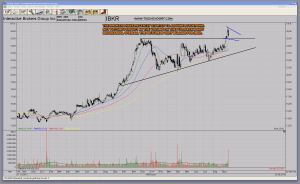
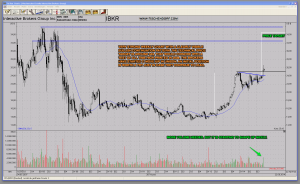
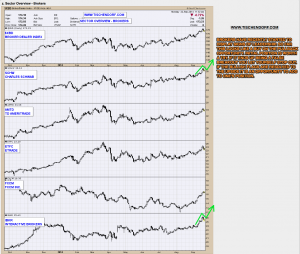
The brokers as group have recently started to assume leadership. IBKR – Interactive Brokers looks interesting here and if the group keeps leading this should be a decent pullback buying opportunity. Initial positions are worth a try here. If the move fails you let yourself stop out. If the stocks build bullish flags and subsequently break to the upside you increase exposure as price would then confirm the bullish analysis.
Click on daily IBKR chart to enlarge:
Click on Weekly IBKR chart to enlarge:
Click on Chart to enlarge:
Chart contains: $XBD – Broker Dealer Index, SCHW – Charles Schwab, AMTD -TD Ameritrade, ETFC – E*Trade Financial Corp., FXCM – FXCM Inc., IBKR – Interactive Brokers.
To anticipate the market is to gamble. To be patient and react only when the market gives the signal is to speculate. – Jesse Livermore
Twitter: https://twitter.com/Tischendorf
Investing in your education always pays. Learn how to read chart patterns like a pro! Tischendorf Letter Premium: https://members.tischendorf.com


