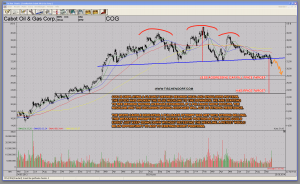
This is a short sell trading idea that was influenced by reading Louise Yamada’s recent oil price analysis and Peter Brandt’s subsequent chart analysis of COG – Cabot Oil & Gas. Here are Louise Yamada’s latest thoughts:
http://louiseyamada.tumblr.com/post/97746179440/energy-the-longer-term-view-suggests-lower-prices
Here’s Peter Brandt’s recent tweet with his weekly COG chart analysis:
Cabot Oil and Gas ($COG) A great short!! 18-mo H&S top Alerted to by a must follow @TechCharts pic.twitter.com/PREa4FKoID
— Peter Brandt (@PeterLBrandt) September 24, 2014
I do come to exactly the same conclusion but I am presenting a daily chart of COG because it offers additional insight. I am talking about a gap that is much easier to see on the daily chart. It is located exactly at the mid point of the projected head and shoulders price target at 23$. That’s another bearish point to consider as it might act as an additional price magnet. Interestingly, if the stock starts to move down it might offer an opportunity to cover and reload. It will most likely also offer additional clues with regards to weakness and strength of COG once it reaches that level. No matter how many people see the same thing, it is just an analysis of a high odds proposition. A more aggressive stop buy above the MA 50 or a more conservative stop buy above 34 to protect your position both make sense as violating those price levels to the upside would invalidate the analysis.
Click on daily COG chart to enlarge:
I sold short an initial position in COG. If the stock keeps moving down without a retest, fine with me. If it retests the neckline, it will offer a pullback entry opportunity to add to an existing short position. Keep in mind Technical Analysis doesn’t offer guarantees. It is merely a useful tool to gauge things. The following three things TA helps with are important ones:
- Are buyers or sellers in control?
- Which kind of move is a high odds proposition?
- Identifying and outlining various scenarios, then managing risk accordingly.
Experienced traders control risk, inexperienced traders chase gains. – Alan Farley
Twitter: https://twitter.com/tischendorf
Investing in your education always pays. Learn how to read chart patterns like a pro! Tischendorf Letter Premium: https://members.tischendorf.com
