As leadership continues to get thinner and fewer and fewer stocks are trading above their respective long-term moving averages, stocks displaying outright bearish patterns are starting to catch my eyes. As strong stocks can rocket higher with the overall market going higher they can also do very well during sideways movements of the market. The opposite is true for weak stocks. Even if the market does not turn down but instead simply decides to go sideways for a while they can still fall hard. My point is, they don’t need an extremely weak market in order to continue to move lower.
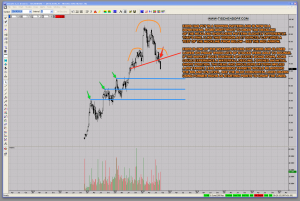
KORS – Michael Kors Holdings is such a weak stock. The chart has put in a head and shoulders top. The way I drew the neckline implies we already saw a retest of the neckline from the downside. Even if one were to draw the neckline in a slightly different way it wouldn’t change the overall bearish outlook of the chart. The head and shoulders pattern implies a price target around the 50$ level. If the target isn’t reached the other blue lines I drew into the chart would offer potential downside targets. The lines are simple to draw, you simply pick former highs in the chart and go from there. I opened an initial short position. Keep in mind stocks tend to fall much faster than it takes them to move higher. Hence the expression:
‘They take the stairs up but the elevator down.’
Click on the KORS chart to enlarge:
To make money in the stock market you either have to be ahead of the crowd or very sure they are going in the same direction for some time to come. – Gerald Loeb
Twitter: https://twitter.com/tischendorf
Investing in your education always pays. Learn how to read chart patterns like a pro! Tischendorf Letter Premium: https://members.tischendorf.com
