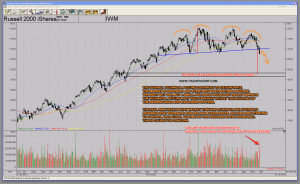
Technically speaking signs of deterioration are increasing. Sellers are starting to gain control. The IWM – Russell 2000 ETF is displaying weakness and increasing signs of distribution. The recent break of the bearish head and shoulders neckline was accompanied by increasing volume. A bearish sign and cause for concern. Granted, the markets are oversold and dip buying has worked for quite some time now. At some point in time though the dip buyers won’t be rewarded. That’s when oversold readings won’t matter because oversold will stay oversold or get more oversold.
Click on IWM chart to enlarge:
The technical price target derived from the bearish head and shoulders pattern would mean IWM is about to overshoot the 100$ level to the downside. We might get a retest of the neckline first. Subsequently we might even get a pattern failure on a strong bounce but the volume increase on the neckline break indicates the long-term bearish pattern has triggered and the downside target is for real.
This is a good time to review How To Trade During Bear Markets. The post contains a list of bear market characteristics and outlines appropriate trading behaviour during bear markets.
Denken heißt selber denken. – Georg Christoph Lichtenberg
Twitter: https://twitter.com/tischendorf
Investing in your education always pays. Learn how to read chart patterns like a pro! Tischendorf Letter Premium: https://members.tischendorf.com

