I went through several hundred gold mining stock charts and most look like they are setting up for a move to the upside. They typically look like GG – Goldcorp does right now. I was very bearish on GG a few weeks ago but have changed my mind since. The technicals have significantly improved and I am in the neutral / slightly bullish camp for GG now. Other gold mining stocks look much better. Overall the HUI – Gold Bugs Index, the ‘Basket of Unhedged Gold Stocks’, doesn’t look too bad. For more aggressive mid-tier gold junior trading ideas check the components of the NYSE listed GDXJ – Van Eck Market Vectors Junior Gold Miners Fund.
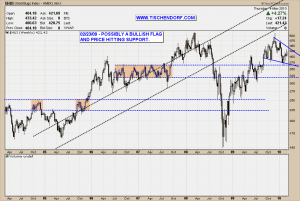
It is still way too early to tell but I am starting to see a bullish wedge type chart pattern. What reinforces the bullish interpretation is the fact price is hitting decent support. A more bearish scenario would be prices going lower in order to build a more sustainable huge W – bottom or double bottom. Supporting a somewhat bullish case would be for the second leg of a potential W – bottom to print a higher low. If, on the other hand, the gold mining stocks would start to break out to the upside at this point in time, they would have the potential to move up significantly as overhead resistance is rather negligible.
Up-to-date HUI – Gold Bugs Index chart on my public list.
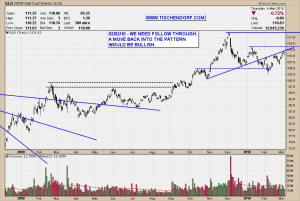
A chart I am closely watching for additional clues is the one for GLD – SPDR Gold Trust Shares ETF. I decided to stick to the rather unconventional ascending triangle chart pattern. The reason why I keep looking at the chart that way is because it is a great way to measure the market participants ‘level of pain’. I consider the pattern a failed pattern. What makes it an interesting one is the fact we might be on the verge of trading back into that very pattern. In technical analysis if prices trade back into a pattern the prior price move out of the pattern is considered to be a false move. False moves or false breakouts are the best setups for powerful moves in the opposite direction as lots of buying pressure comes from trapped traders. It is a scenario where in addition to regular buyers, traders who need to close out and reverse their position add fuel to the fire. From a psychological standpoint it is very similar to classic short squeezes.
Up-to-date GLD – SPDR Gold Trust ETF chart on my public list.
We are not there yet, but if the gold miners break out in the near future this move has the potential to seriously trap traders. As usual, the charts and price action will tell us what to do.
I’m going to go where the markets take me.
Have a great evening!


{ 1 trackback }
Comments on this entry are closed.