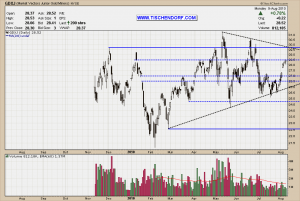
Recently gold junior miners have been quite strong. They have started leading the big caps. NEM – Newmont Mining, ABX – Barrick Gold and GG – Goldcorp are basically going nowhere right now. If you compare the GDXJ – Market Vectors Junior Gold Miners ETF with GDX you clearly see GDXJ displaying relative strength. GDX is a big cap gold miner ETF, whereas the GDXJ components are more aggressive juniors in the mid-cap range.
Up-to-date GDXJ Chart + GDX Chart on my public list.
From a technical perspective GDXJ was threatening to break down. Recent price action shows GDXJ has respected the lower trend line as support. The chart pattern now looks like a triangle (black trend lines). Judging from the pattern, I would expect a break out to the upside. The pattern still needs a bit more time to build more pressure for the impending breakout. My best guess would be to expect some thrusting action in about 2-3 weeks.
Tempora mutantur nos et mutamur in illis.
My public list with all my charts can be viewed here:
http://stockcharts.com/def/servlet/Favorites.CServlet?obj=ID2791469
Buenas noches!
