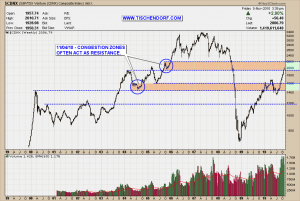
Updated the CDNX – Canadian Venture Composite Index on my public list. The chart is about to hit a key price area very soon. What is noteworthy, is the huge volume accompanying the move into what looks like what could possibly be serious resistance. As I state in my chart annotations ‘Congestion zones often act as resistance’. The huge up-move we have witnessed was indicative of relentless buying pressure. What facilitated this fast and furious price appreciation is the precipitous fall the Venture Composite index experienced in 2008. The index basically went into free fall, that’s why we have to move further back in time to see congestion zones. That is, price areas where price lingers for longer periods of time because pressure builds or there is uncertainty as to which direction price will move next.
That being said the most recent price history before reaching today’s price level is called an ‘air pocket’. This explains why price moved up that fast as there was no price congestion on the way down. Put another way: Price went up almost as fast as it went down.
A problem I see developing is the above mentioned fact of the huge volume we recently witnessed. On the one hand huge volume is good as it confirms price action. On the other hand further price increase would be best supported with a further increase in volume. In this case that could very well turn out to be blow-off type volume. We are not there yet. I just wanted to outline a few thoughts on price and volume.
Up-to-date CDNX – Canadian Venture Composite Index chart on my public list.
One could argue the true congestion zone is actually located in-between both coloured price bands drawn into the chart. I would agree. Nonetheless, I chose to draw two price bands. If price gets rejected it will be much easier to see how price bounces in-between those two price bands. Let’s see what happens.
Two things to keep in mind:
- Everything above the upper price band should be considered overhead resistance.
- Overhead resistance tends to be less important the further back in time it occurred.
Especially in an ambiguous situation, the tendency for everyone to be looking to see what everyone else is doing can lead to a fascinating phenomenon called “pluralistic ignorance”. – Robert Cialdini
My public list with all my charts can be viewed here:
http://stockcharts.com/def/servlet/Favorites.CServlet?obj=ID2791469

{ 1 trackback }
Comments on this entry are closed.