Looking at the sector overview charts on my public list I still cannot come up with any decisive conclusion. The market is starting to display more weakness and lots of stocks and sectors are threatening to roll over. We could still turn to the upside from here though as it doesn’t look like a good entry point to aggressively go short. In other words a bounce could indeed materialize as some stocks could move up due to oversold conditions. Still, aggressively going long here is not exactly tempting either. I consider this to be a true inflection point in the markets. It feels like the market is about to show its hand very soon.
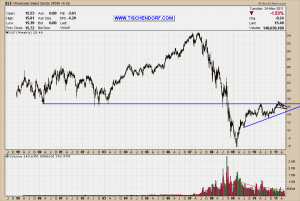
A good way to monitor the situation would be to watch how the financial related stocks do. The XLF – Financials ETF is a great instrument for that purpose. There are diametrically opposed views flying around when it comes to systemic risk. Watching the financials is the way to gauge sentiment related to that type of risk. No matter what your opinion might be, rising bank stocks at this market juncture would be very healthy, constructive technical action and would provide the fuel for another price advance for the indices. Think ‘healthy sector rotation’.
Click on the chart to maximize.
Bullish signs would be: A bullish flag pattern consolidation pattern building up pressure right below long-term horizontal resistance. One could also make a valid argument for a bigger bullish ascending triangle pattern.
Bearish signs would be: Ever declining volume while price kept going higher. Huge overhead resistance. Price almost breaching the flag pattern to the downside.
Conclusion: For the market to be able to put in some sound and significant advance we would have to see the financials move up from these levels. If the financials break down from here it could spell potential trouble ahead. The financials look weak and at the same time oversold and ripe for a bounce. We are truly at an inflection point.
XLF is part of my financials sector overview chart containing the following stocks: GS – Goldman Sachs, BAC – Bank of America, C – Citigroup, JPM – J.P. Morgan Chase, KRE – Regional Banks ETF, XLF – Financials ETF.
If you don’t know where you are going, you’ll probably end up somewhere else. – David Campbell
My public list with all my charts can be viewed here:
http://stockcharts.com/def/servlet/Favorites.CServlet?obj=ID2791469
Buenas noches!

{ 3 trackbacks }
Comments on this entry are closed.