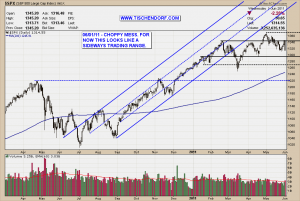
What a choppy mess… Judging from yesterday’s action the markets looked like they wanted to move higher and maybe even be on their way to take out the April high. Instead we printed an ugly reversal candle, giving back all of yesterday’s gain and then some. Technically speaking lots of stocks display bearish engulfing candlestick patterns. This could be the first sign of more technical damage to come.
As of yet I would still expect a choppy sideways trading mess. The former uptrend has now clearly morphed into a sideways pattern as you can see on the S&P 500 chart below:
Up-to-date S&P 500 chart on my public list.
What is worrisome though is the price action with the financials. In my recent Technical Analysis of XLF – Financials ETF I stated we were at an ‘inflection point’. We haven’t seen any kind of healthy sector rotation yet. Quite on the contrary. The XLF and especially C – Citigroup and BAC – Bank Of America keep acting weak and technicals are deteriorating by the day. The financials need to stop their incredible underperformance relative to the S&P 500 otherwise the markets will have a tough time going forward.
Conclusion: Right now stock picking will only yield good results if you are very good and if your holding period is short term oriented. As much as I may sound repetitive: In choppy markets you will die a slow death if you are not extremely disciplined. The best piece of advice I can give is to stay mostly in cash and to patiently wait for overall market conditions to improve. Remember: As traders our job is to be aggressive only when the stars align. ‘Sell in May and go away’ so far has turned out to be the right thing to do. Summer trading is typically tough. Stay calm and focused.
What we plant in the soil of contemplation, we shall reap in the harvest of action. – Meister Eckhart
My public list with all my charts can be viewed here:
http://stockcharts.com/def/servlet/Favorites.CServlet?obj=ID2791469
Buenas noches!

{ 3 trackbacks }
Comments on this entry are closed.