The Market Vectors Agribusiness ETF MOO has generated a multi-year technical buy signal on the weekly chart. The daily chart shows a break-away gap on Friday, albeit on low volume. As you can see in my chart annotations a pullback to the breakout level would represent a more or less ideal buy point.
As MOO – Agribusiness ETF is a slow mover I am expecting a pullback. As you can see in the chart the weekly moving average 30 is showing an upward slope. It’s impossible to tell if MOO will simply move higher or pull back first. When in doubt, the best way to handle this type of situation is to buy an initial position and to buy more on a pull back or on further strength.
Click on the weekly MOO chart to enlarge:
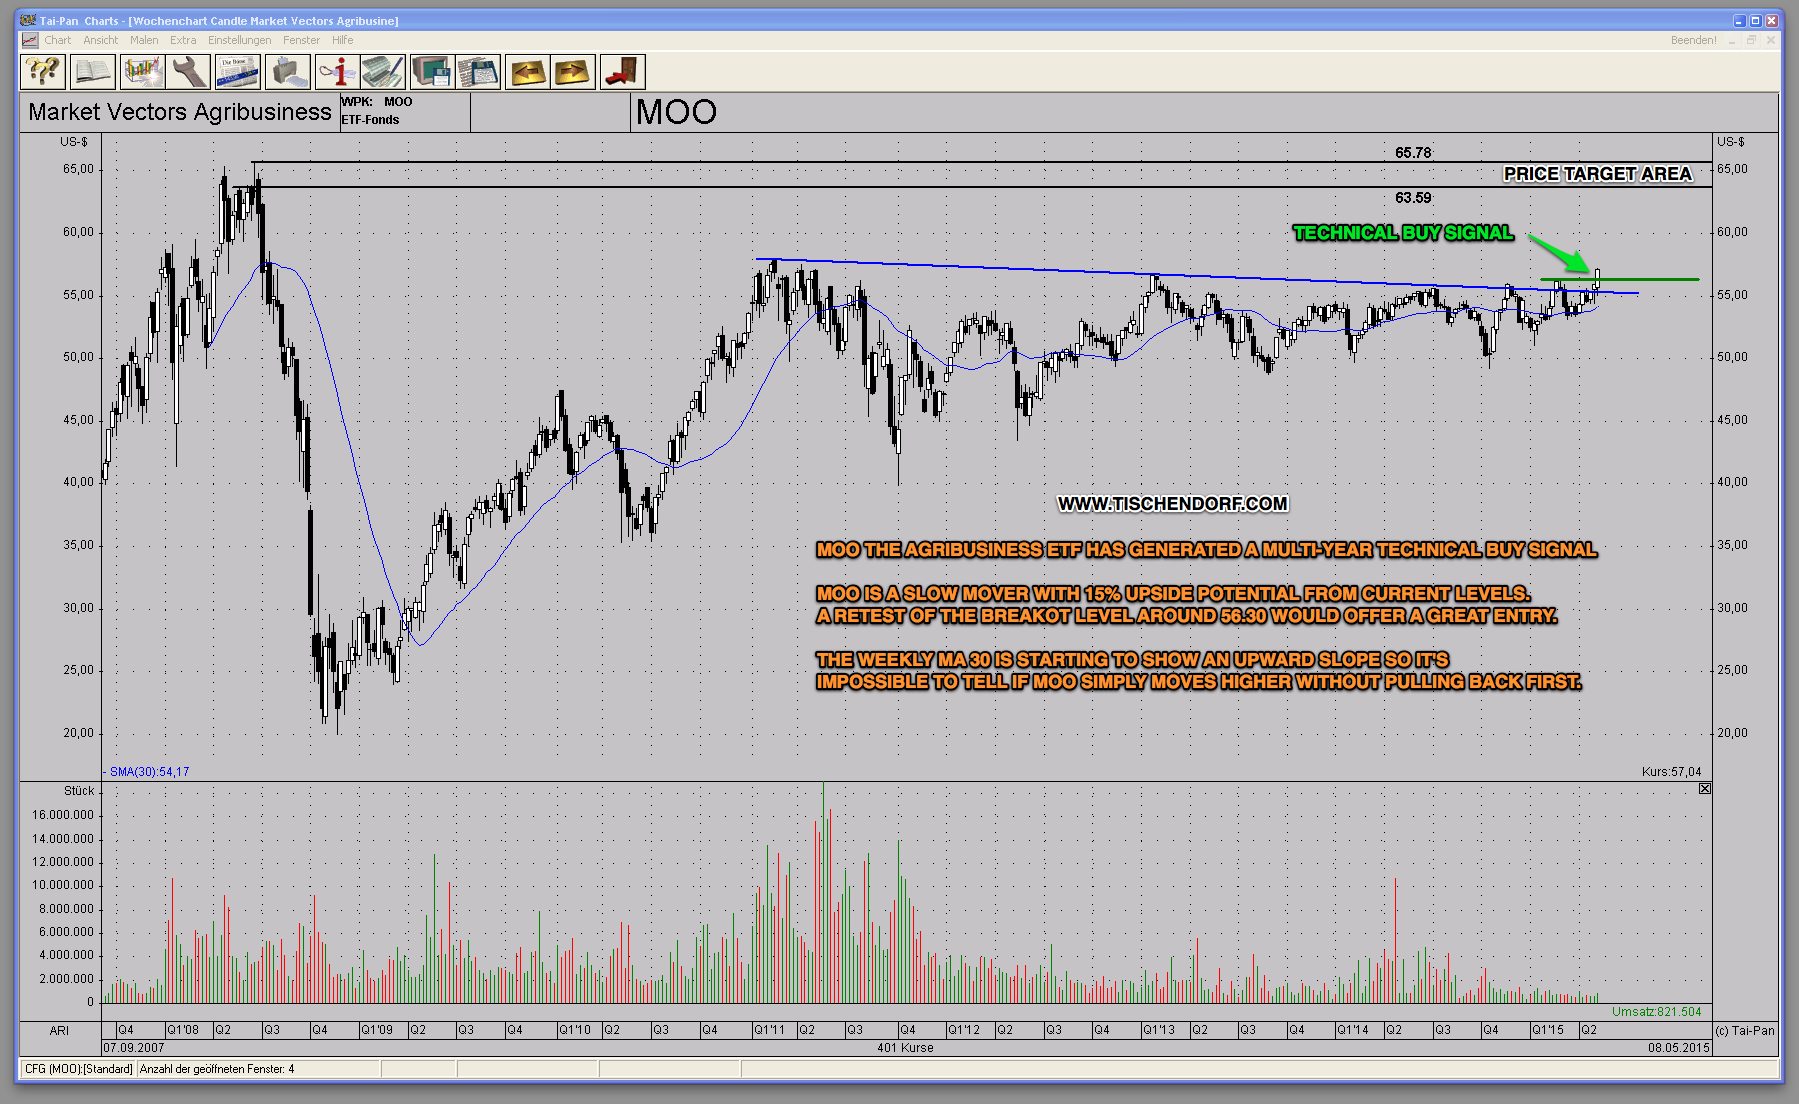
Conclusion: MOO has roughly 15% upside appreciation potential. The price target area is the all time high area the stock printed 7 years ago. The pattern at hand is a huge base that offers a lot of pattern pressure. If we get decent follow through soon, the trend should accelerate.
To give you an idea what this ETF is all about, right now the 12 biggest US listed MOO holdings in terms of percentage net assets are:
SYT – Syngenta, MON – Monsanto, DE – Deere, ADM – Archer Daniels Midland, POT – Potash Corp of Saskatchewan, ZTS – Zoetis, AGU – Agrium, MOS – Mosaic, CF – CF Industries Holdings, TSN – Tyson Foods, BG – Bunge, TSCO – Tractor Supply
Update 05/12/15:
So far this looks like a normal retest of the breakout area. The true bull move will start once MOO closes above the green line. Somewhere around 57.20 – 57.50 should be the trigger.
Click on the daily MOO chart to enlarge:
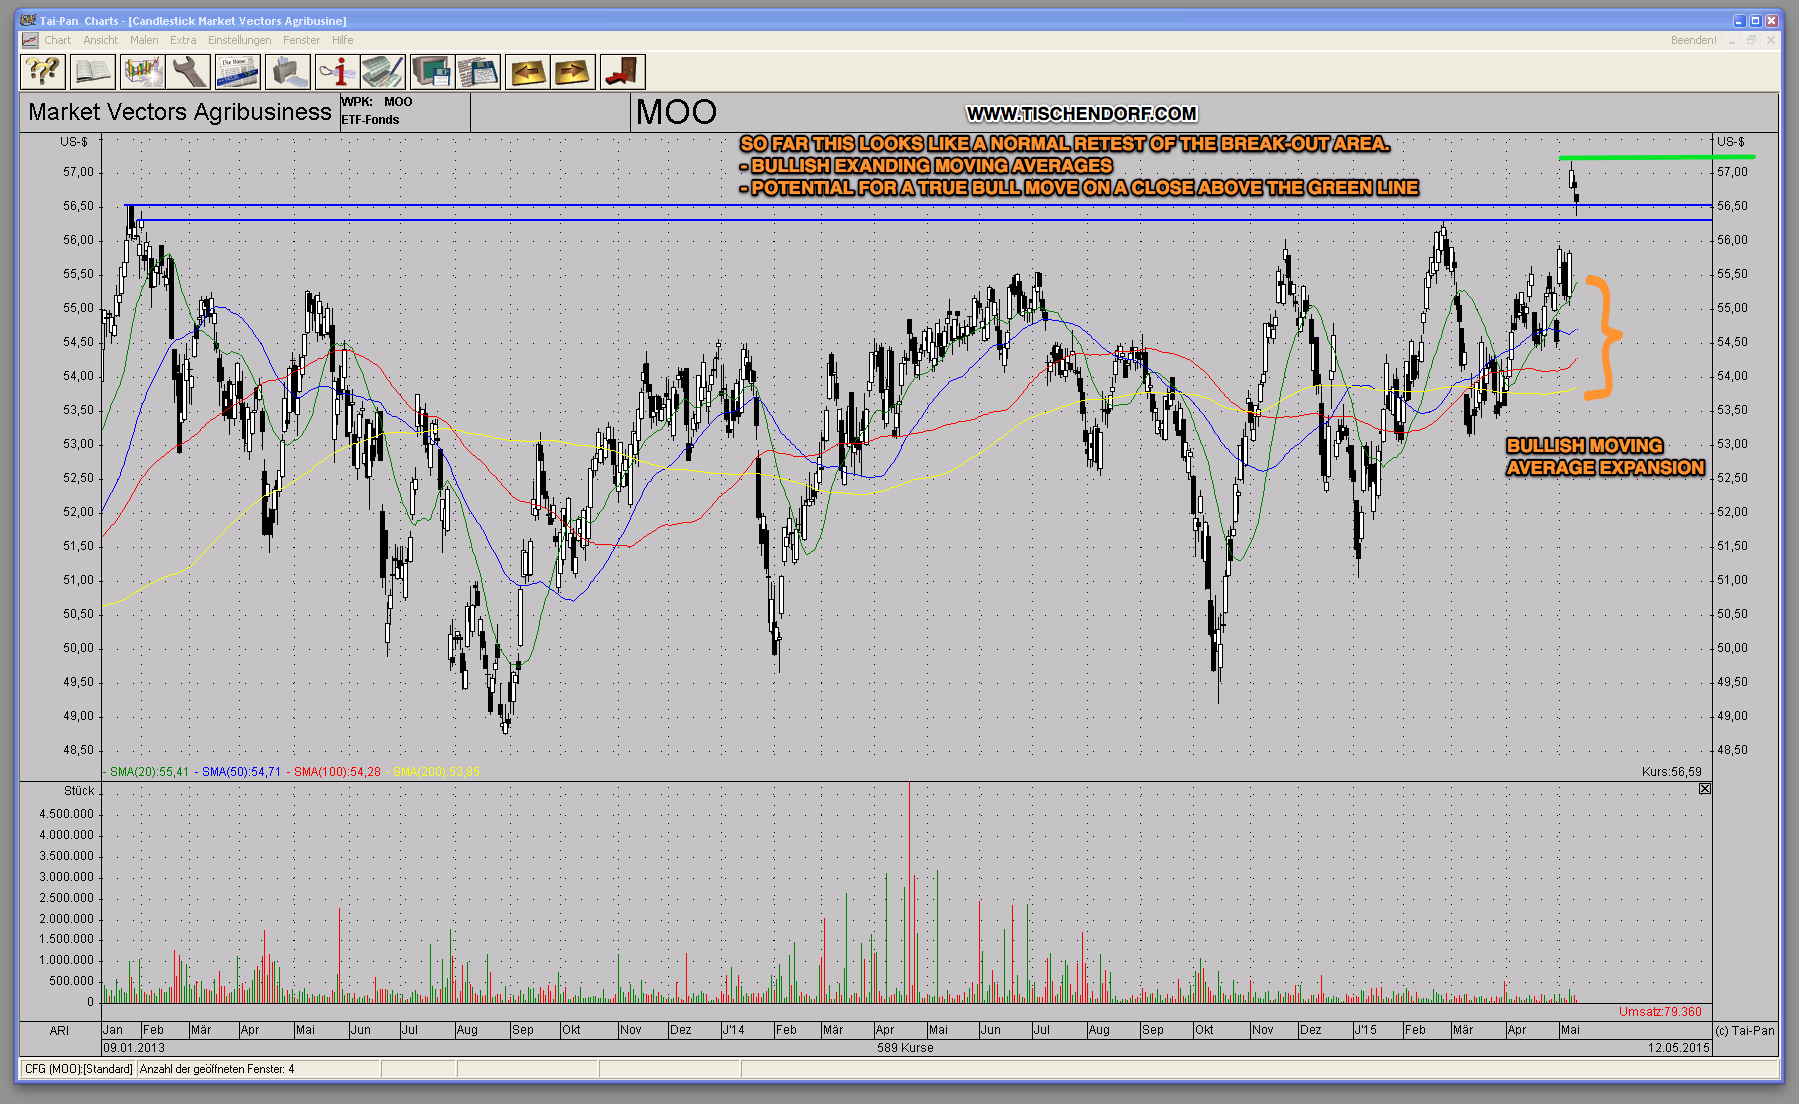
The one thing that stands out on the daily chart is the beginning stage of moving average expansion. This is very bullish action and signals the potential for a big run.
Agriculture Sector Overview – Chart I.
Agriculture Sector Overview – Chart II.
Update 05/14/15:
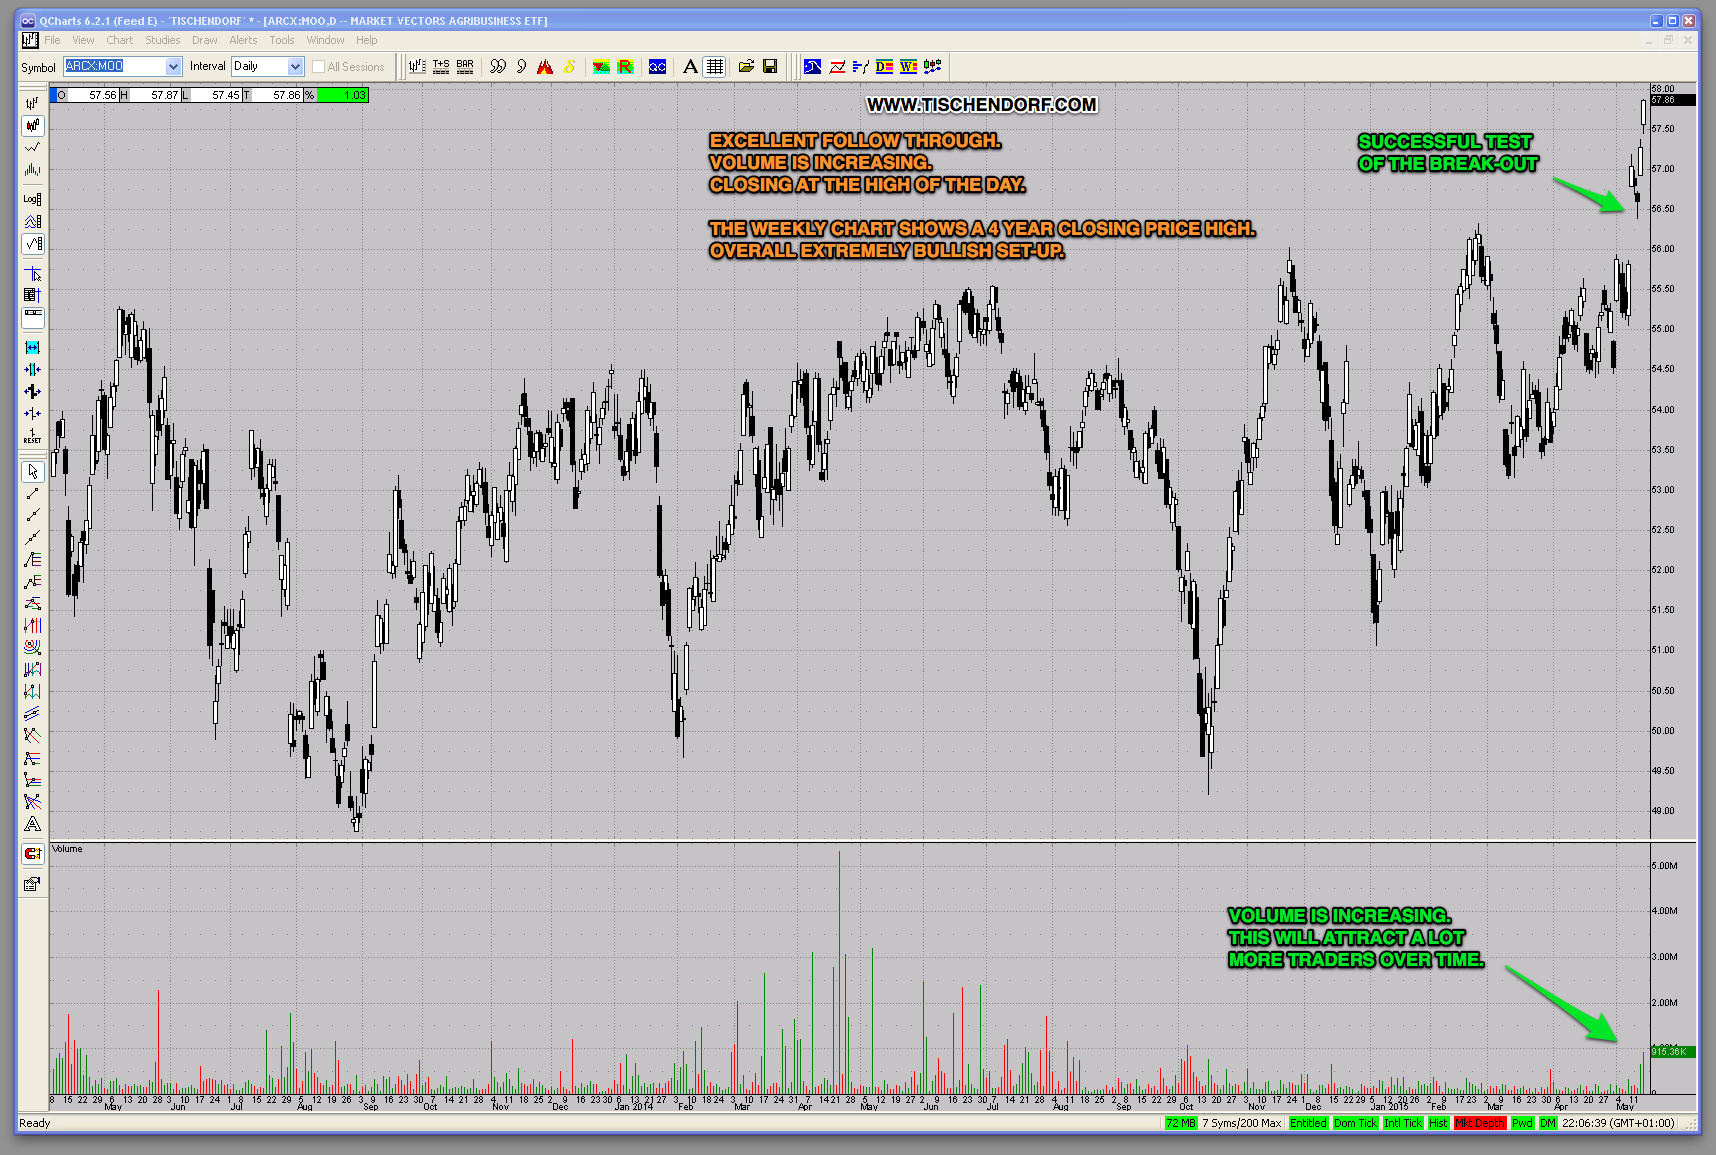
The multi-year break-out level test was successful. Overall the technical chart set-up looks extremely constructive. The increase in volume is very bullish as MOO will now pop up in technical volume scans. This will attract more traders, long-term buyers and investors.
The instant you learn to trade reality, not wishes, you will break through the wall of fire to become a successful trader. – Larry Williams
Twitter: https://twitter.com/Tischendorf
Investing in your education always pays. Learn how to read chart patterns like a pro! Tischendorf Letter Premium: https://members.tischendorf.com