About a week ago I tweeted a monthly chart showing the UNG – Natural Gas ETF’s reversal candle and its potential for a tradable bottom:
$NG_F$UNG$UGAZ Bullish monthly hammer reversal candle. #natgaspic.twitter.com/SoLss8Vd9W
— Olivier Tischendorf (@Tischendorf) May 5, 2015
For those of you who can’t see the embedded tweet, click on the UNG chart to enlarge:
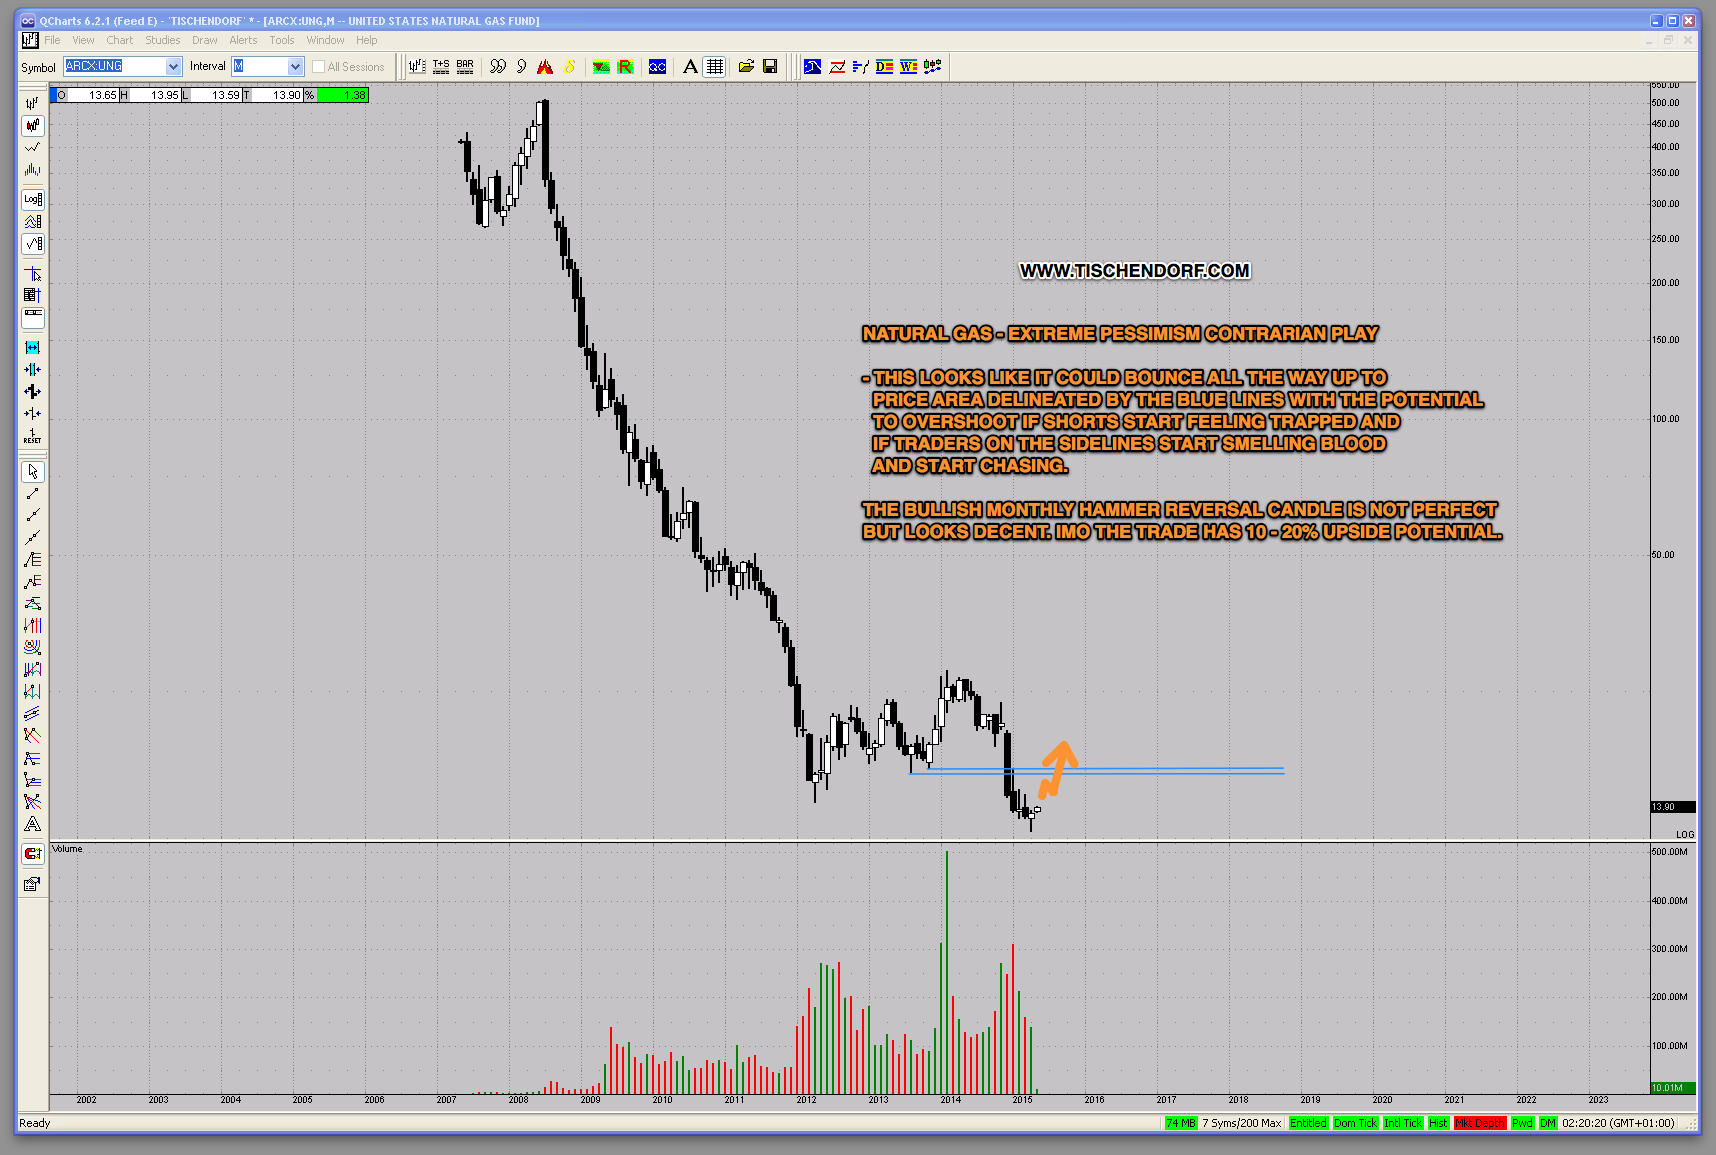
What prompted me to post that monthly chart is what I would interpret as ‘seller’s exhaustion’. UNG was unwilling to go lower. When that’s the case the only way a stock can go is up. So far the trade has worked. Make no mistake, this is not a ‘strong chart’ type of trade. There is massive overhead resistance. But if UNG’s reluctance to go down is for real, this kind of set-up has the potential to develop into a short squeeze inflicting serious pain on short sellers.
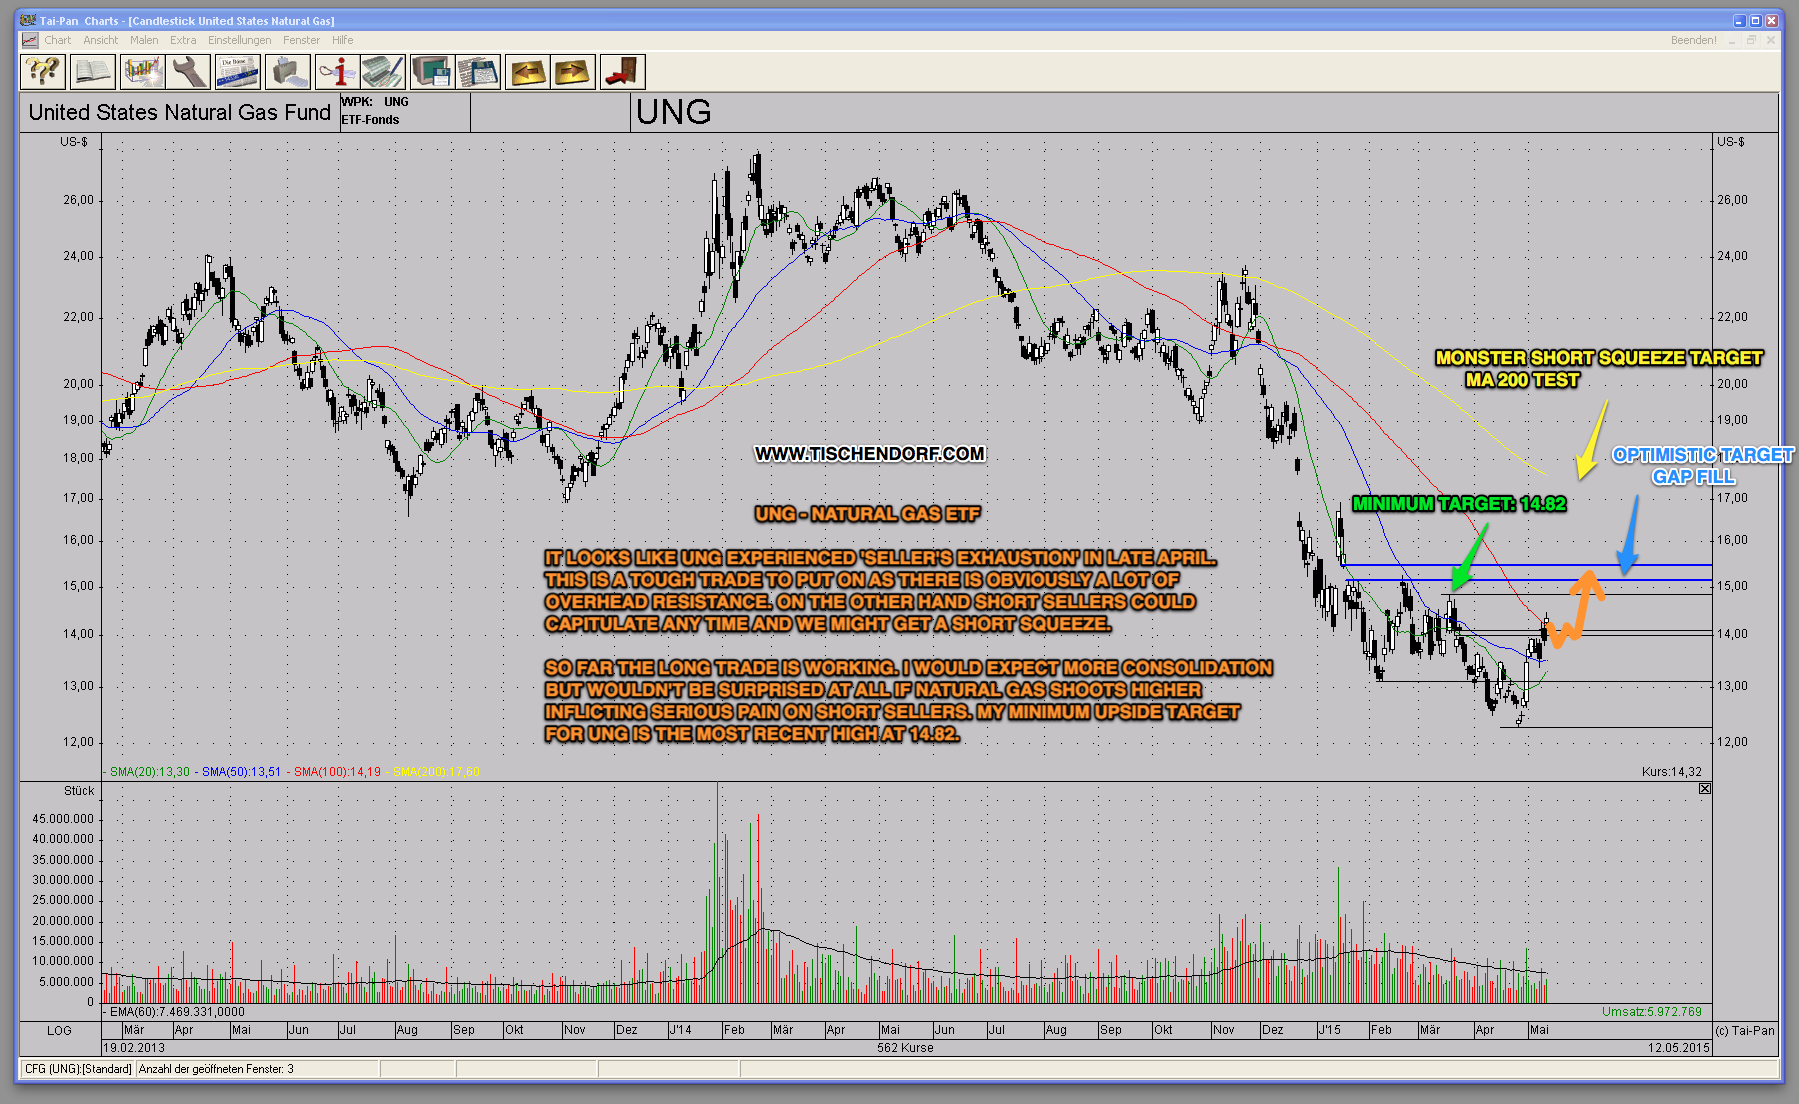
As you can see, my chart annotation shows the various potential upside targets if my ‘seller’s exhaustion’ thesis proves to be correct. Although UNG could pull back anytime my minimum upside target remains 14.82, the most recent high. A more optimistic target would be the gap area around 15.30. If we are to witness a full blown short squeeze UNG could be on its way to test the declining moving average 200. For very aggressive players UGAZ the 3x leveraged ETF would be a way to play this potential move.
Successful traders tend to be instinctive rather than overly analytical. – Joe Ritchie
Twitter: https://twitter.com/Tischendorf
Investing in your education always pays. Learn how to read chart patterns like a pro! Tischendorf Letter Premium: https://members.tischendorf.com