The bearish trend with Twitter – TWTR keeps trapping a lot of traders. This price behavior is the exact opposite of social media winning stock Facebook – FB. Following a few simple technical guidelines will help you avoid painful losses in the future. I believe the main reason why so many are stuck in ‘hope mode’ with Twitter is due to a very common human tendency.
People use the product, I do use Twitter as well, they end up liking it a lot and then they draw conclusions. In this case they equate the company and their positive user experience with the stock.
Drawing such a conclusion can be a very painful and costly experience. Just because a company is perceived to be great doesn’t necessarily mean its stock price action has to be great as well.
Click on Twitter – TWTR chart to enlarge:
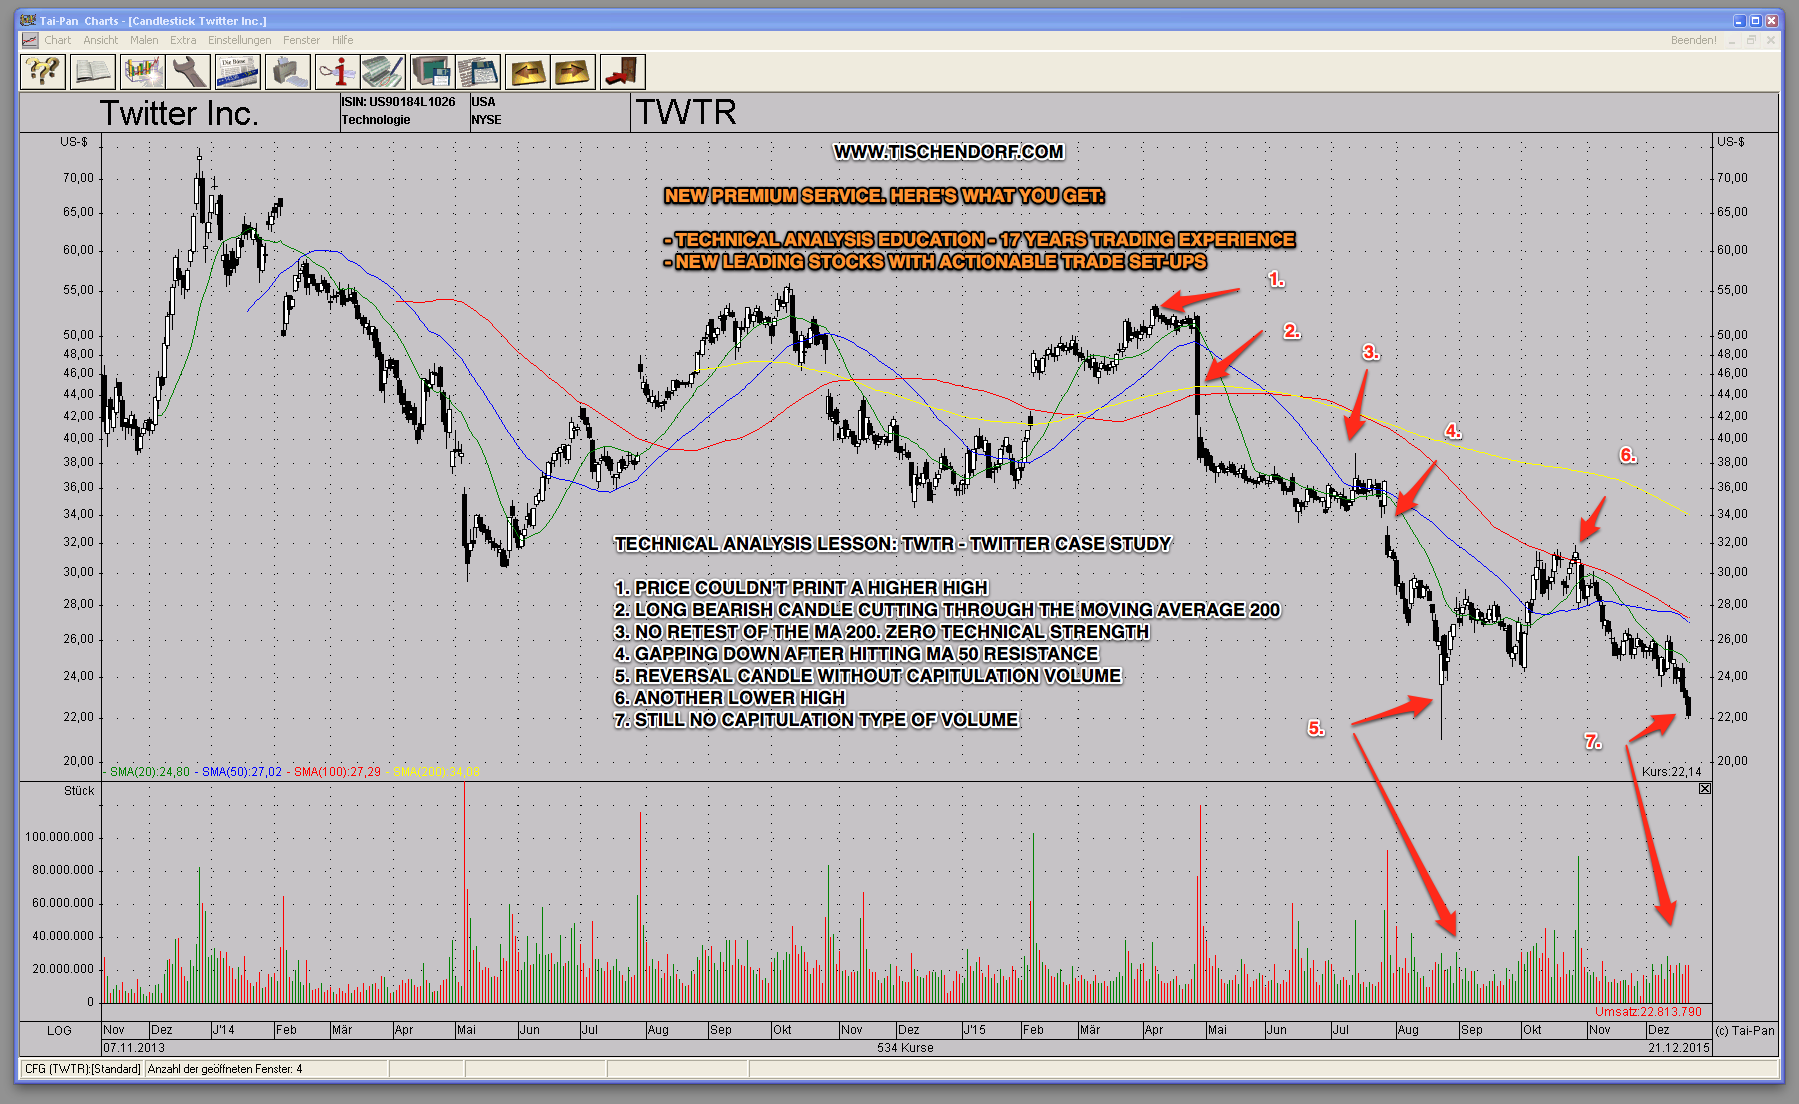
Following a few simple rules will make sure you avoid a lot of pain. As you can see in the chart above everything happens for a reason. It should come as no surprise that TWTR closed at an all time low today. Here is how everything started:
- Price couldn’t print a higher high.
- Long bearish candle cutting through the major moving average 200 like a hot knife through butter.
- No retest of the MA 200. Zero technical strength.
- Gapping down after hitting the moving average 50 resistance.
- Reversal candle without capitulation volume.
- Still no capitulation type volume.
Every single observation listed above was a danger sign and a signal to exit a money losing stock trade.
Profit from my 17 years of trading experience. Learn how to correctly interpret technical signals and get exposure to the best leading stocks:
Tischendorf Letter Premium