The current move to the upside in the market is tempting to buy. After all, there is never a shortage of bottom callers. From a purely technical perspective though, so far it is producing nothing more than counter trend rallies. This TSLA – Tesla Motors chart update shows why longs should remain very cautious.
So how do you know this is only a counter trend rally and not the beginning of a brand new up trend?
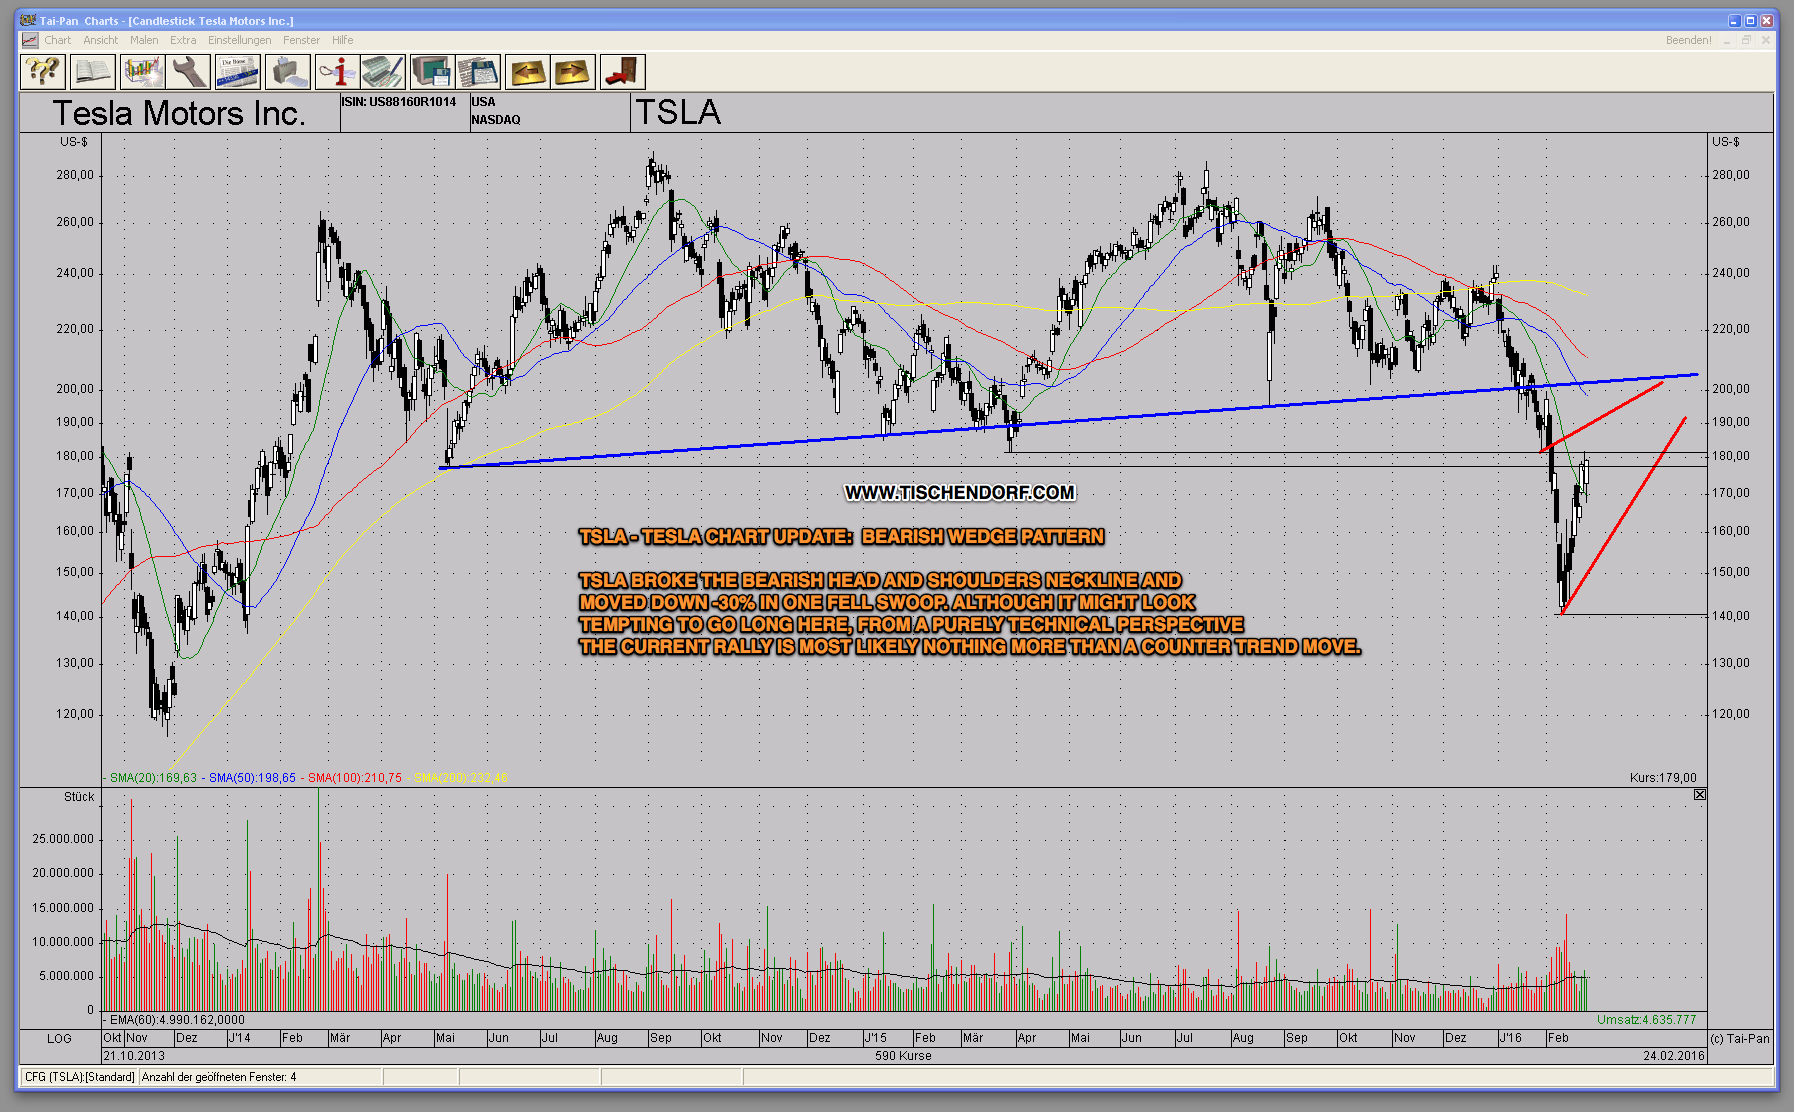
I am glad you asked. Nobody ‘knows’ the future and that is precisely why technical analysis is so helpful. It simply helps gauging the odds. With TSLA the odds are high we are witnessing a bearish wedge pattern, a classic bearish counter trend continuation chart formation, that should ultimately break to the downside.
Click on TSLA – Tesla chart to enlarge:
Here’s a short list of reasons why the technical picture remains bearish:
- Everybody who bought the past 2 years is down. –> Overhead Resistance
- Price is trading below all major moving averages.
- The MA 200 is trending down
- Decreasing volume during the current price recovery
- Horizontal resistance lines drawn across former pivot lows (black lines)
- Neckline resistance (blue line)
How did the plunge set up? TSLA Tesla — VIDEO — Review With Price Targets
Conclusion: Professional traders use counter trend rallies to unload positions. They can move much higher and last much longer than most expect. The purpose of these moves is to suck in unsuspecting new longs. That facilitates the unloading of shares from the pros. Keep in mind that there is huge overhead resistance producing enormous selling pressure. As long as moving average alignment is bearish, it is best to either stand aside or to be short TSLA.
I won’t buy a stock when it’s dropping even if I like the fundamentals. I have to see some stability in the price action before I buy the stock. Conversely, I might also use a stock’s chart to trigger the sale of a current holding. Again, the charts are a very unemotional way to view a stock’s behavior and potential. – Richard Driehaus ‘Market Wizard’
Want to know when to be in the market and when to be out?
Tischendorf Letter Premium: https://members.tischendorf.com
{ 1 trackback }
Comments on this entry are closed.