The development with Apple is worrisome. Here’s an important technical update of the AAPL – Apple chart and my thoughts on APPL’s future price development.
The massive bearish head and shoulders pattern outlined in my recent AAPL Apple Chart Analysis remains firmly in place. The distribution pattern hasn’t reached its technical target yet. Quite the opposite is the case. Selling pressure is increasing by the day.
Why is that so? Here’s how technical analysis can help you:
What we are witnessing with APPL right now is called ‘pattern morphing’. After breaking the neckline of the bearish head and shoulders pattern APPL put in a swift move to the downside. The stock then started to stage a counter trend rally and initially formed a bearish wedge pattern. The pattern was aborted quickly and morphed into a much more bearish descending triangle pattern.
The reason why the descending triangle is more bearish is because sellers are stepping in very quickly. They are so eager to sell that they are not willing to wait for higher prices to unload shares and lighten up their position. From a psychological perspective this simply means that ‘Sellers are in control’.
Click on AAPL – Apple chart to enlarge:
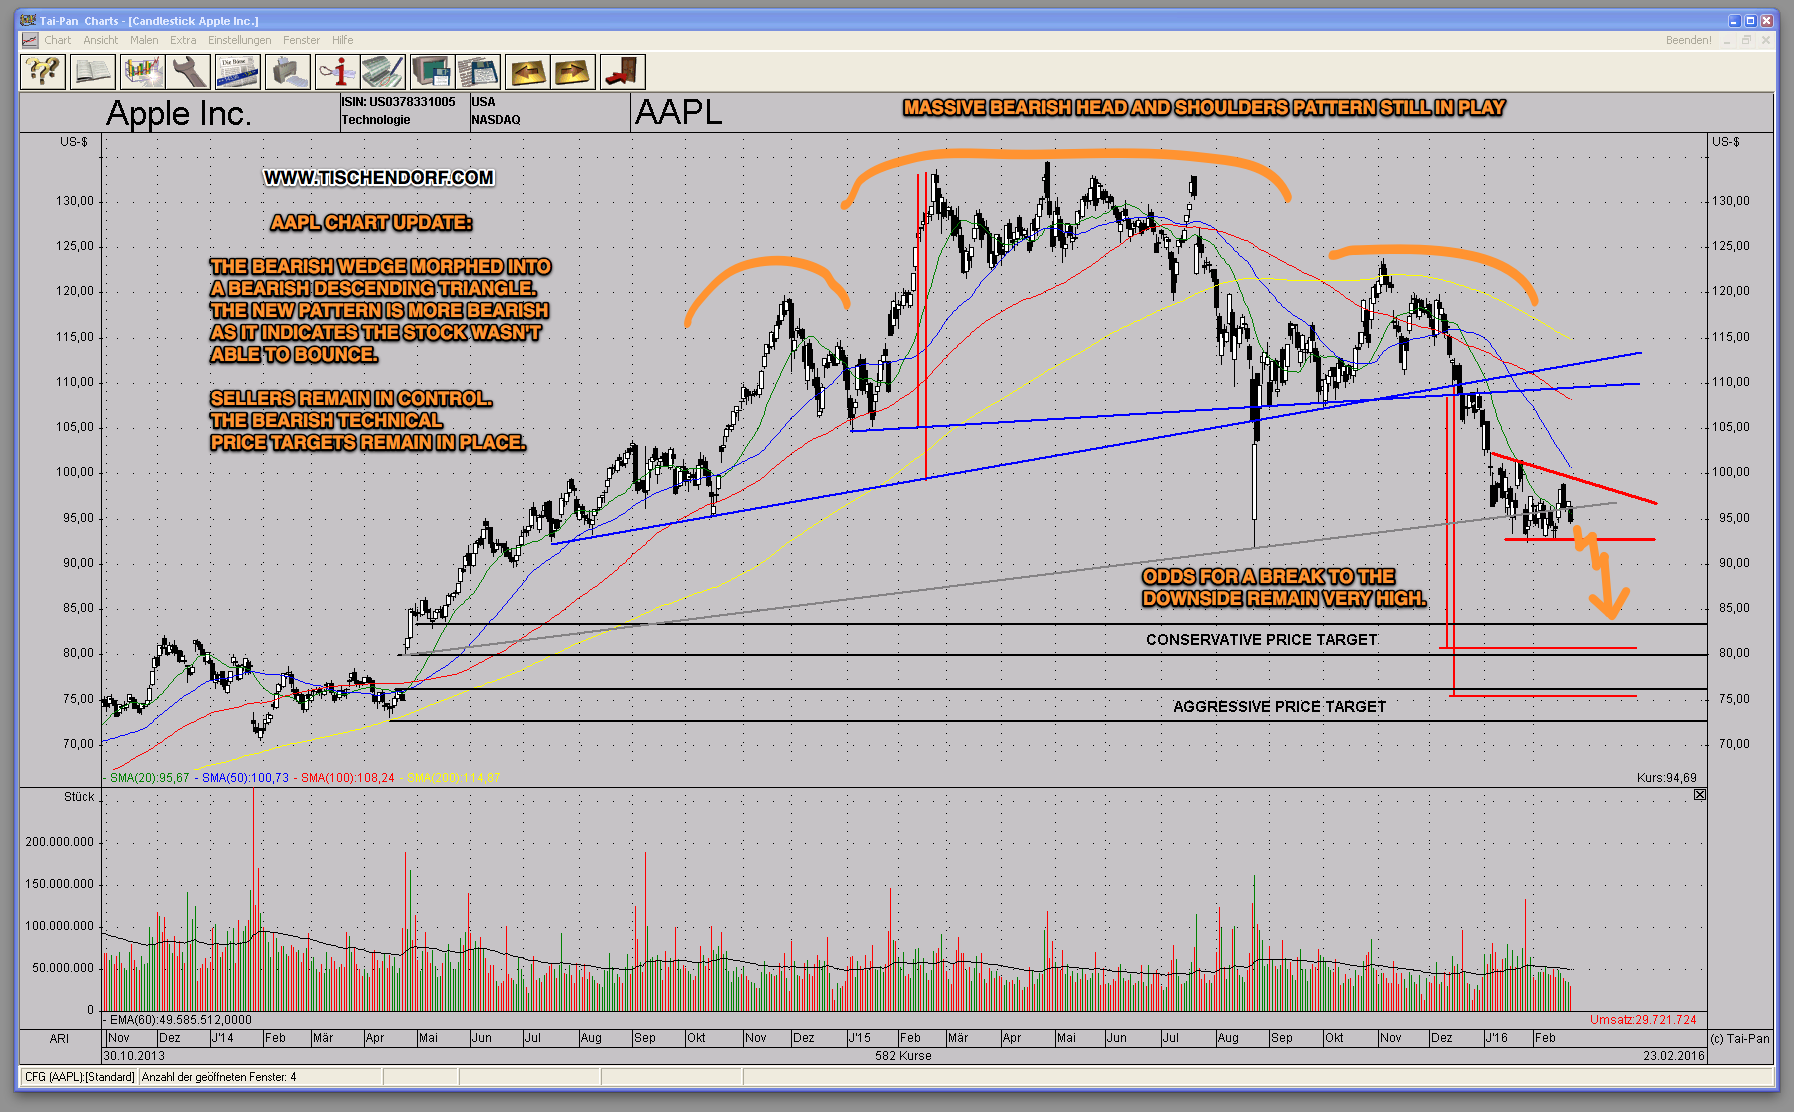
From a purely technical perspective the technical price target remains in the $75 – $80 range. When sellers have the upper hand and the trend is pointing down it is important to remember odds favor lower prices. Hence the frequently used trading quote:
In downtrends, surprise moves tend to be to the downside.
Learn how to read chart patterns like a pro!
Tischendorf Letter Premium: https://members.tischendorf.com
{ 2 trackbacks }
Comments on this entry are closed.