The topping formations with indices like the QQQ – Nasdaq 100 ETF and the SPY – S&P 500 ETF are still very much alive. There is tremendous distribution going on in the markets.
There is no way to tell if this is going to end up only being an intermediate term top, something that in hindsight would be looked at as a ‘correction’. Or, if on the other hand a much more pronounced correction is forming that will end up being the beginning of a ‘nasty bear market’ lasting much longer.
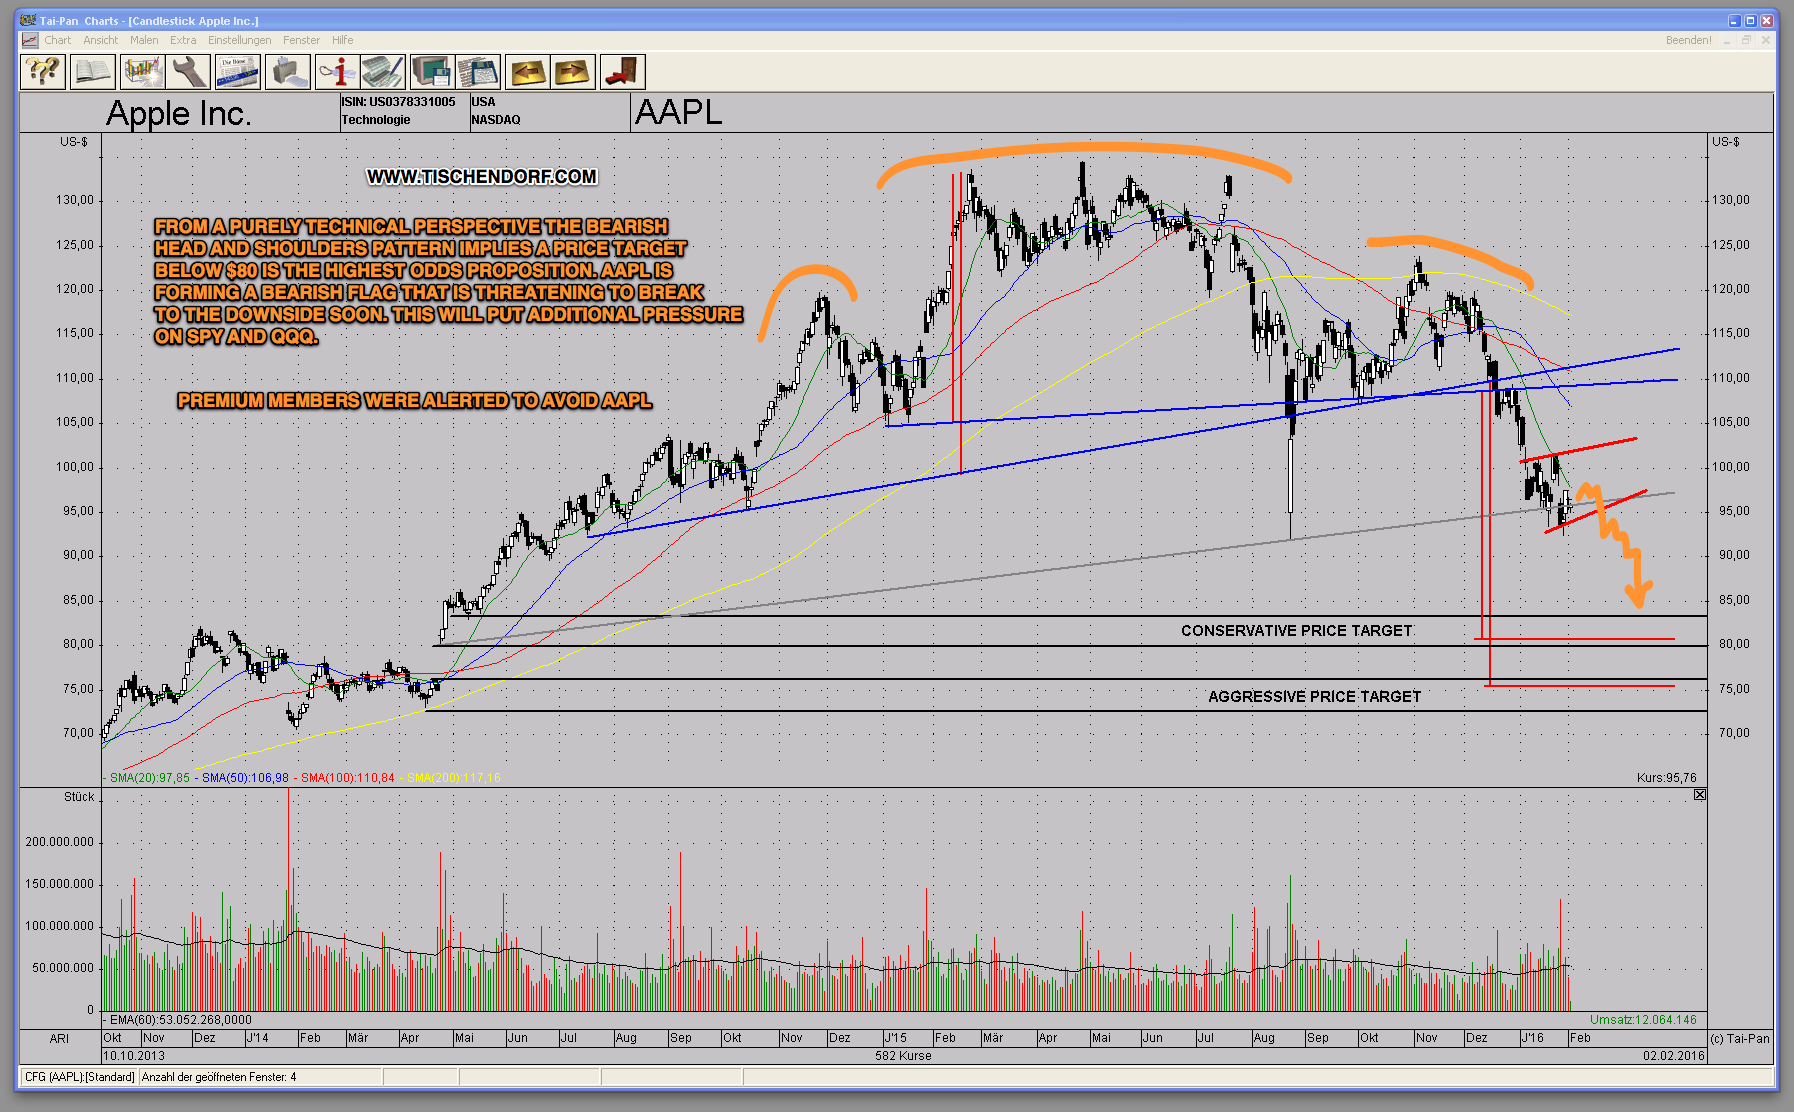
Stocks like AAPL have formed clear bearish head and shoulders chart formations. The technical price target implies much lower prices below $80 US Dollars for AAPL – Apple. This most likely means additional serious selling pressure for various indices for at least another few weeks.
Click on AAPL – Apple chart to enlarge:
February 23, 2016: APPL – Apple Chart Update
Members are still in cash and not fighting this downtrend. Learn how to keep your profits and get more analyses like the one above: Tischendorf Letter Premium
{ 3 trackbacks }
Comments on this entry are closed.