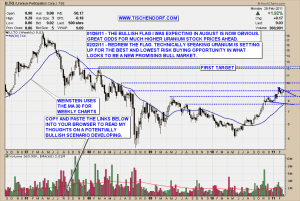
More thoughts on U.TO – Uranium Participation the proxy I use in order to stay on top of what looks to be a very promising bull market in Uranium. I updated the U.TO chart on my public list as the first price target for the next leg up is now becoming more obvious.
Up-to-date U.TO – Uranium Participation chart on my public list.
As you can see in the chart above we have a typical ABC or 1-2-3 formation developing. It’s always the same. Thrusting move, consolidation pattern, ideally on declining volume, thrusting move resuming the direction of the trend leading into the consolidation pattern. This is not rocket science. Again, one of the lowest risk entries is when price moves towards a rising weekly moving average 30.
The U.TO price target is derived using two different methods:
- The first one is a simple support resistance analysis. You simply go back in time and look for obvious price pivots. Then you draw horizontal lines. Price tends to be attracted or rejected when it nears those price areas. This method indicates a price target of 12.00 CDN$ being most likely.
- The second one is to use price projections. In U.TO’s case it would mean computing the price difference from the start of the thrusting move at around 5.50 to the end of the thrusting move at around 8.5. Then you simply add that number, in our case 3.00, to the subsequent breakout level. I am typically not using the traditional concepts which would imply slightly higher price targets. I prefer to use a more conservative approach. In U.TO’s case my price target would be 8.5 + 3.00 = 11.50 CDN$.
As I state in my chart annotations I consider the 11.50 – 12.00 CDN$ price zone to be the first price target. If those levels are indeed reached and price stalls in that area it will be time to reevaluate. Still, at that point in time it would have to be considered early in the game as it would only be the second higher base within this new uptrend. From a purely technical perspective this wouldn’t be considered as being too extended or displaying typical characteristics of exhaustion. Thus, it would imply further upside for Uranium. We are not there yet. For now let’s stick to a step by step approach.
Judging from the chart and the distance to the weekly moving average 30 U.TO is trading at, we could still experience a move down shaking out weak hands. My best guess would be more consolidation for another 2-4 weeks. This could either result in sideways trading action or price pulling back some more. Then, the window of opportunity to position accordingly in Uranium stocks will most likely close very fast. Let’s see what happens. Hat tip to Charles Kirk for tonight’s quote!
If you believe in yourself and have dedication and pride and never quit you’ll be a winner. The price of victory is high, but so are the rewards. – Bear Bryant
My public list with all my charts can be viewed here:
http://stockcharts.com/def/servlet/Favorites.CServlet?obj=ID2791469
Buenas noches!
