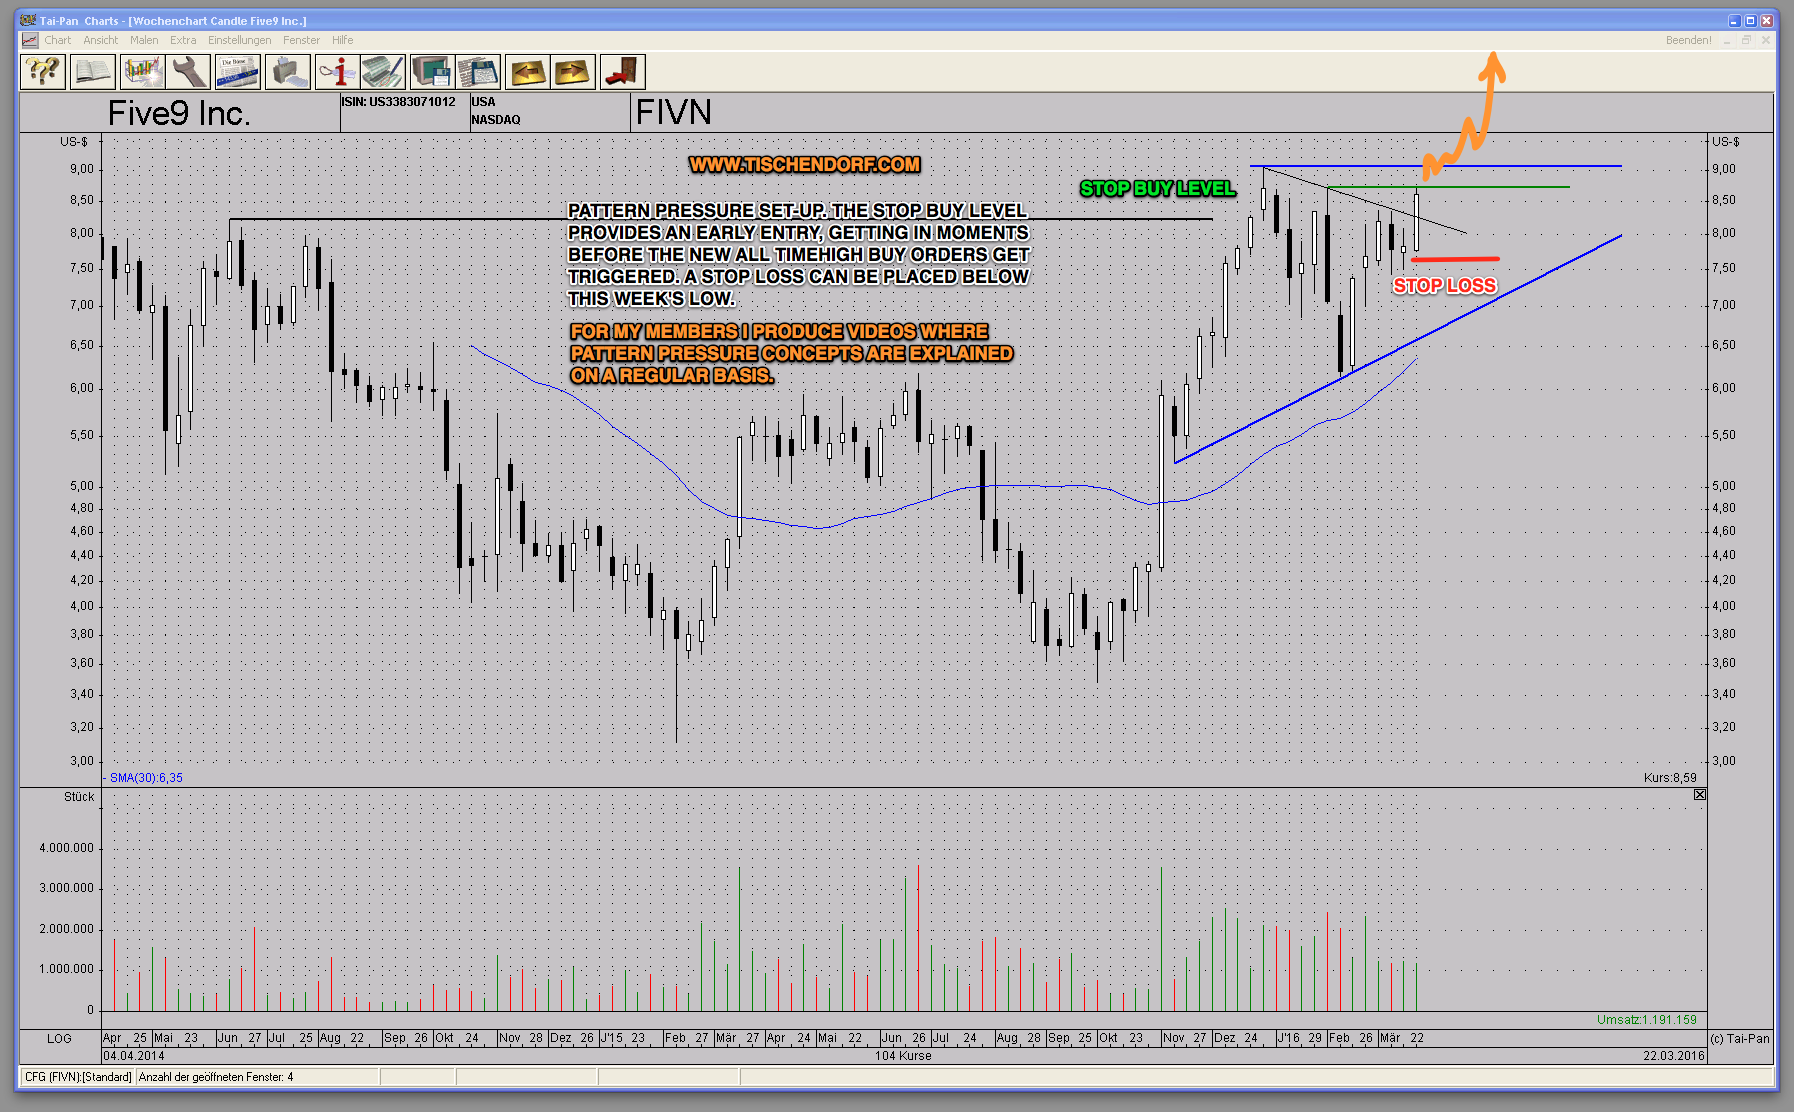
A very powerful set-up is starting to shape up with FIVN – Five9 Inc. The chart is displaying a chart pattern with incredible Pattern Pressure, a concept I talk about in detail in Videos produced for Members.
FIVN – Five9 Inc. provides cloud software for contact centers in the United States and internationally. The stock is building huge pressure on both the weekly and the daily chart. The stock is trading very close to its all time high, a very bullish sign.
A very bullish sign indeed, as the ability to print a new all time high would put the stock on many traders’ radar. If the stock can bust out of its bullish ascending triangle it will qualify as a ‘New Leader’.
The added bonus is the simple fact the stock won’t have any overhead resistance. All the traders owning the stock will be in the green and show a profit. They won’t have any reason to sell, that is what typically provides the fuel for a sustained move to the upside.
Click on FIVN – Five9 Inc. Weekly chart to enlarge:
Click on FIVN – Five9 Inc. Daily chart to enlarge:
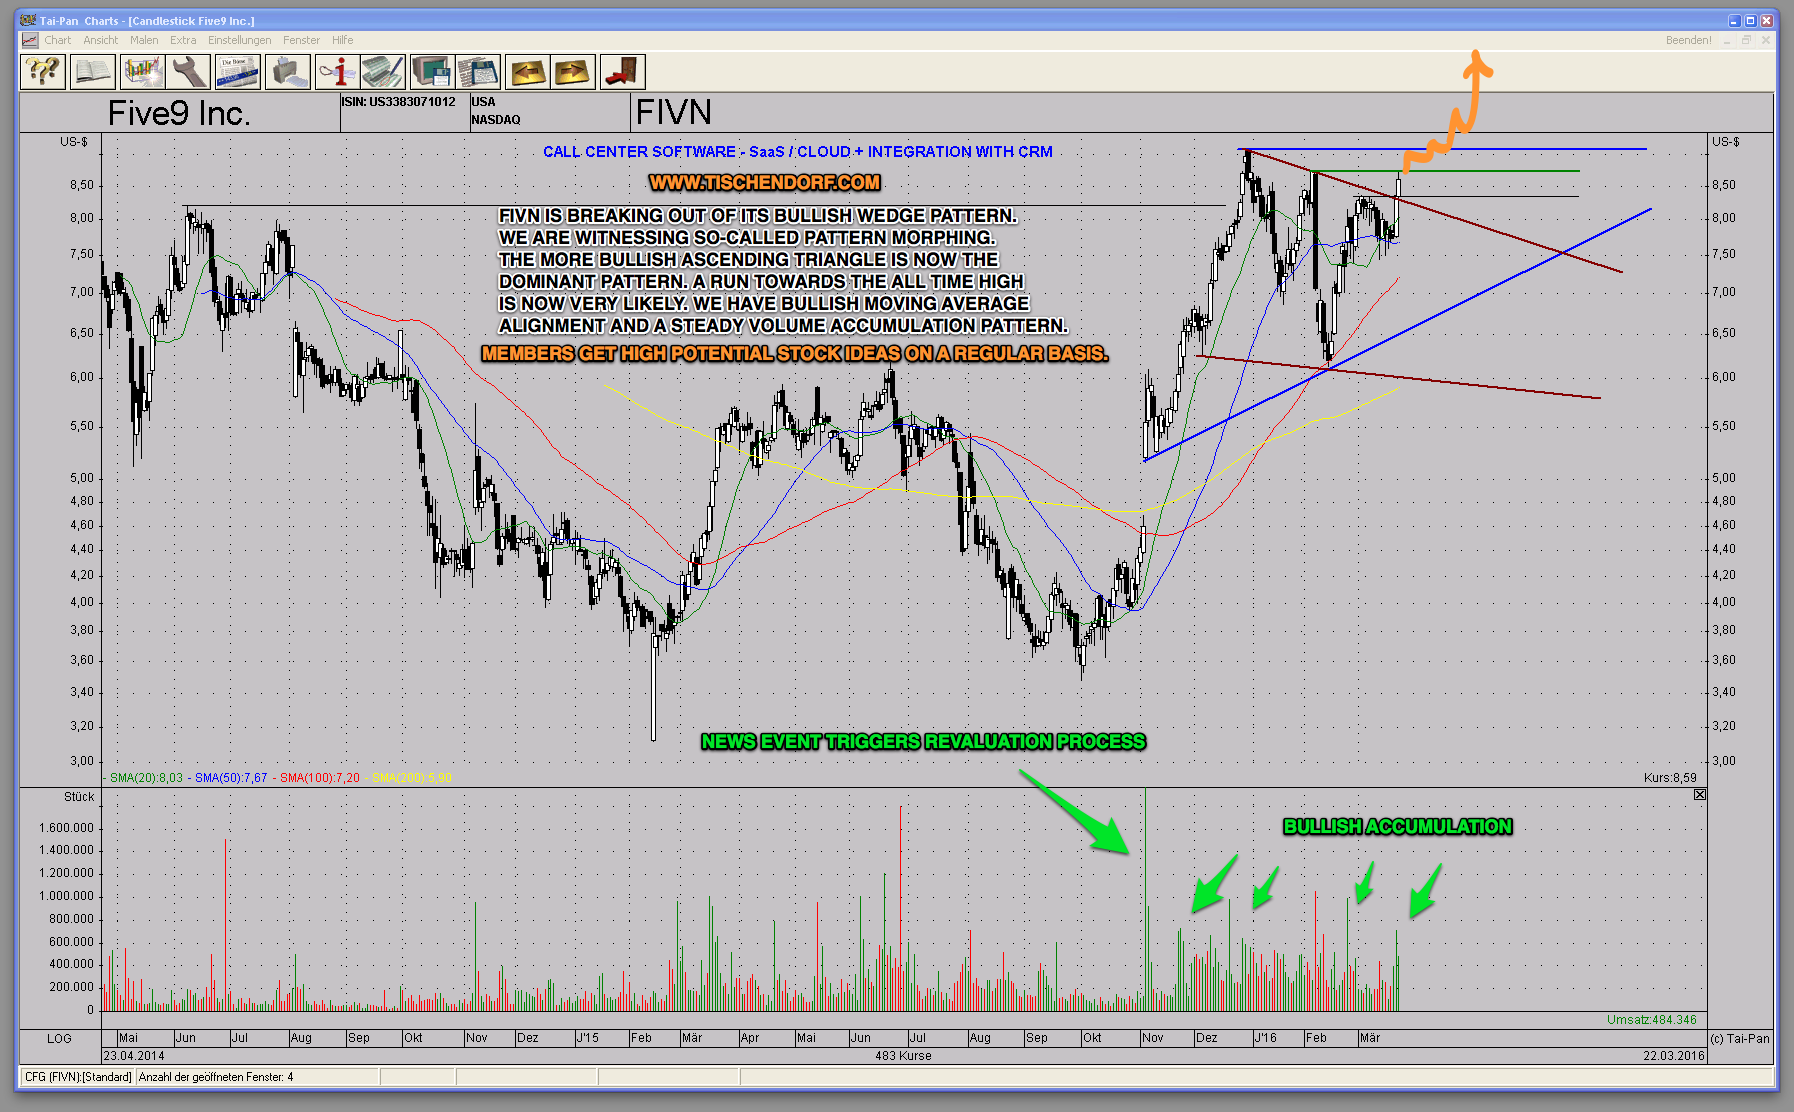
The daily chart shows the chart of a typical future winner:
- Bullish news event
- Huge gap up
- Big volume spike
- Revaluation process starts
- Bullish continuation pattern
- Overall big pattern pressure set-up
- Stock trades near its all time high
Conclusion: In addition to all the bullish factors providing an ideal setup for potentially much higher prices ahead, a classic TA concept is now developing in real time. We are witnessing ‘Pattern Morphing’. The stock has broken out of a bullish falling wedge pattern. Now the more bullish ascending triangle pattern is the dominant pattern. A break out to new all time highs implies much higher prices ahead. The overall pattern looks similar to a loaded spring that is waiting for pent-up pressure to be released. The purely technical price target is around $12.
Twitter: https://twitter.com/tischendorf
Investing in your education always pays. Learn how to read chart patterns like a pro!
Tischendorf Letter Premium: https://members.tischendorf.com