Your average gold bug has been calling for the US Dollar’s demise for as long as I can think of. Price is telling a different story. We are witnessing a strong new uptrend. As usual you do have a choice here. You can do one of the following:
- Believe their narrative.
- Base your trading decisions on price.
I cannot repeat this often enough: Think independently. This is the ONLY way to protect yourself. The downside is, you will need to assume full responsibility and won’t be able to blame anybody for your portfolio performance. Enough said.
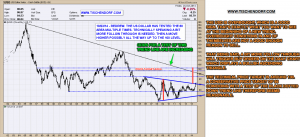
Click on $USD monthly chart to enlarge:
Always up-to-date $USD US Dollar monthly chart on my public list.
The technical price target should be around 100. Therefore a more conservative target around 95 seems reasonable. That would coincide with a test of the dotted black down trend line.
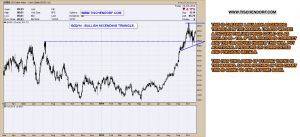
Click on $USD daily chart to enlarge:
Always up-to-date $USD US Dollar daily chart on my public list.
The daily chart shows a bullish ascending triangle in the making. Right now the US Dollar is one of the strongest currency around. A bit more follow through and we will come closer to the completion of the triangle. This will trigger additional buy orders resulting in a resumption of the uptrend in typical ABC pattern fashion.
Keep in mind the following: Strong overbought conditions at the beginning of a new trend are a good sign. They are not in and of themselves a good enough reason to sell. They are merely a sign of how strong the trend is. Trading UUP or USDU are ways to profit from that trend.
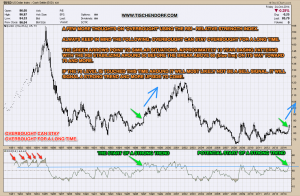
Click on $USD RSI Relative Strength Index chart to enlarge:
Conventional wisdom usually leads to interpreting RSI incorrectly. As you can see in my RSI analysis there are two things to keep in mind that are counterintuitive:
- Overbought can stay overbought for a long time.
- When the RSI rises toward overbought after a long basing pattern, it signals the start of a new up trend
It goes without saying a rising US Dollar will most likely put additional pressure on commodities and precious metals. The SLV – Silver ETF chart certainly looks bearish, a move higher with the US Dollar, could trigger a further decline.
Normality is death. – Theodor W. Adorno
Twitter: https://twitter.com/Tischendorf
Investing in your education always pays. Learn how to read chart patterns like a pro! Tischendorf Letter Premium: https://members.tischendorf.com


{ 1 trackback }
Comments on this entry are closed.