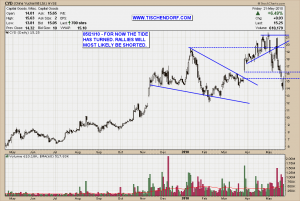
We got our bounce from extremely oversold levels. Still, volume on the upside as opposed to the one encountered on the downside is not convincing. Most of the traders and websites I follow are starting to shift their focus on selling rallies. There’s still an opportunity for the markets to prove most market participants wrong and to test 52 week highs. Odds have decreased significantly though. The selling has been brutal, a clear warning sign traders should pay close attention to.
To make a long story short, here is an example of a stock displaying a lot of the characteristics corroborating the assumption the tide has now probably turned towards a ‘sell the rallies’ mentality. The stock I am referring to is CYD – China Yuchai a Chinese automotive stock I have written about in the past. In my book it’s an important chart to watch, along with CAAS – China Automotive Systems, as it is a great way to gauge how stellar performers that have recently traded near their 52 week highs will behave if we are to witness a decent bounce. It’s also a great proxy to measure the health of China and the Chinese markets. Also keep an eye on the Shanghai Index Chart for additional clues.
Up-to-date CYD – China Yuchai chart on my public list.
What’s very telling if you look at the chart featured above is the fact price will have to fight through massive overhead resistance. There are now multiple reasons the stock will have a hard time to move up convincingly:
- The recent gap has now turned into resistance.
- Volume during the down move has increased.
- We almost printed a lower low. Former highs have been breached. Sellers are most likely in control now.
- Price failed to move up from the bullish ascending triangle. The lower trendline of pattern is now resistance.
- Price almost fell back into the bullish wedge pattern. Falling back into bullish patterns after a breakout is a bearish sign.
The jury is still out where the markets are headed. For now a sell the rallies mentality prevails. Trading from the long side will work best with stocks that have almost no overhead resistance as traders usually like to short the weakest stocks. Also keep in mind it is very typical for stocks with no overhead resistance to significantly outperform.
Let’s see how ‘they’ are going to move the markets…
This ‘they’ theory of the market is quite as prevalent among successful traders as among beginners – probably more so. There may be room for argument as to why this is so, but as to the fact itself there is no doubt. Whether ‘they’ are a myth or a definite reality, many persons are making money by studying the market from this point of view. – G.C. Selden ‘Psychology of the Stock Market’
My public list with all my charts can be viewed here:
http://stockcharts.com/def/servlet/Favorites.CServlet?obj=ID2791469
Buenas noches!

{ 4 trackbacks }
Comments on this entry are closed.