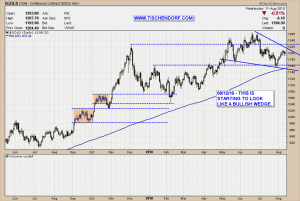
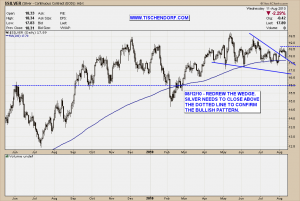
Another post as I updated quite a few charts on my public list. The most notable one is the potentially bullish wedge pattern with gold I am starting to see. I also redrew the wedge pattern for silver. This could be a classic case of chart patterns triggering buys with different market participants trading different time frames. If silver can move up and induce traders who base their buy decisions on weekly charts to buy, silver would have the potential for a great thrusting move to the upside. Although the short term pattern for silver doesn’t look as convincing as the one for gold the long term chart for silver looks extremely compelling.
Up-to-date Gold Price chart on my public list.
Up-to-date Silver Price chart on my public list.
You might want to reread the following posts:
- Buying gold and silver for insurance purposes
- Credit Crisis Explained – Video
- Long term Silver Price Chart Analysis
A government big enough to give you everything you want is a government strong enough to take everything you have.
My public list with all my charts can be viewed here:
http://stockcharts.com/def/servlet/Favorites.CServlet?obj=ID2791469
Buenas noches!


{ 1 trackback }
Comments on this entry are closed.