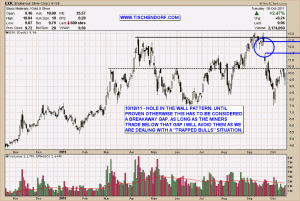
This is meant as a follow-up post to my GDX / GDXJ technical video analysis of the break-away gap patterns prevalent in most of the gold and silver mining stocks. Alan Farley coined the term ‘Hole in the wall pattern’. This gap pattern after a long rally has to be considered a break-away gap until proven otherwise.
In plain English: As long as the gap area acts as resistance traders should view the mining sector as offering shorting opportunities.
Up-to-date EXK – Endeavour Silver Chart on my public list.
The beauty of the pattern lies in the fact one doesn’t need to predict anything. It’s a classic situation where patience will pay off, no matter what will ultimately happen price wise. As long as price trades below the gap you either go short or sit on the sidelines. If the miners get killed you don’t get hurt. If, on the other hand, the stocks can negate the bearish pattern you can re-enter and play the mining stocks from the long side. The benefit is obvious. Technically speaking you will then be long stocks that have proven themselves. To make a long story short, do what the charts tell you to do. Forget about your opinions. It’s as simple as that. The market doesn’t care about your opinions.
On to the markets:
I have put on some trades that could turn out to be very short term. That’s why I am not publishing them. It will stay that way until I feel the market is suitable for position trades.
- S&P 500 / overall market: It sure looks like the bulls are starting to get back in control. We still aren’t in a strong overall trending environment though. We could easily fall back into the trading range.
- AAPL – Apple: The stock is down 6% in after-hours trading. As I’ve stated a while back: In my opinion there is absolutely NO WAY this stock will be the leader of the next cyclical up-trend. This stock is everybody’s darling. Everybody, and I mean absolutely everybody, knows about this ‘great company’. If you think buying into this kind of situation will make you rich, I urge you to think twice. Justin Mamis addressed this issue extensively in ‘The nature of risk’ which is one of my favourite books. He talks about ‘price risk’ versus ‘information risk’. One of the most important concepts when it comes to trading. Here’s the gist of it: The less information risk you have the more price risk you have. Apple is a picture perfect example for his analogy. Tonight’s gap down has the potential to be the beginning of the end. The ‘end’ obviously doesn’t mean the stock will go back all the way down. It simply means it could do what MSFT – Microsoft has been doing for the past 12 years. Trading in a sideways range and simply going nowhere.
- IBM – International Business Machines: Same story. A leader stock putting in a gap down after a long rally lasting multiple years. This could be a ‘changing of the guard’ type of situation. The old leaders will be taken to the woodshed or might shift into a decade long sideways trading range and new leaders will emerge and replace them. Watching how IBM and AAPL deal with those gaps will be telling.
Events can move from the impossible to the inevitable without ever stopping at the probable. – Alexis de Tocqueville
My public list with all my charts can be viewed here:
http://stockcharts.com/def/servlet/Favorites.CServlet?obj=ID2791469
Buenas noches!

{ 3 trackbacks }
Comments on this entry are closed.