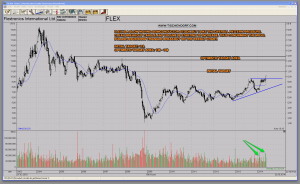
A slow moving semiconductor stock trading idea with a great looking chart. I like the overall pattern pressure of this bullish ascending triangle breakout with FLEX – Flextronics. The chart pattern is clean and smooth. A decisive breakout candle following a tight consolidation pattern. Volume is starting to come in, thus confirming the upside move. The initial price target is 11$ and the more optimistic price target would be around 13-14$. For aggressive players seeking broad based semiconductor exposure SOXL the 3x leveraged Semiconductor ETF would be a way to play that theme.
Click on chart to enlarge:
A short excerpt / quote from ‘The Perfect Speculator’ I like:
There are no infallible systems. If there was one, the market would cease to exist. As the infallible system will clean up the market. Once one accepts that fact, one is well on his or her way to getting a grip on the market. As long as one is still looking for the infallible system, he or she will continue to be beaten up by the market. And the second point of reality one needs to face is that all that is needed to be a successful speculator is in the price/volume action of leading stocks and leading indices. – Brad Koteshwar
Twitter: https://twitter.com/Tischendorf
Investing in your education always pays. Learn how to read chart patterns like a pro! Tischendorf Letter Premium: https://members.tischendorf.com
