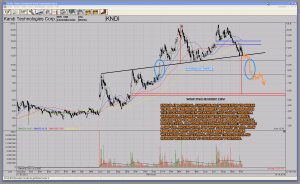
Another follow up post on KNDI – Kandi Technologies with my updated chart thoughts on the ‘Air Pocket’ concept that is starting to become more evident. In simple terms, an air pocket is a price area where a stock didn’t spend much time to travel through. Most of the time stocks tend to display the same behaviour when they encounter identical price areas. In plain English: On the way up it took KNDI two days to move from 8$ to 12$. On the way down odds are it will take roughly the same amount of time. We most likely are witnessing a long-term topping pattern with KNDI. Recently KNDI hit resistance and the path of least resistance now looks to be down. The real risk for longs in KNDI is for the stock to hit that air pocket. If KNDI mimicks the behaviour on the way up it would mean a quick move to the downside is in the cards.
As I always remind my readers: In downtrends ‘surprise moves’ tend to be to the downside. With KNDI odds for bad things to happen are increasing by the day. For now I see no reason whatsoever to cover my short position. The stock is weak and I remain short.
Click on KNDI chart to enlarge:
The aggressive price target of the double top pattern would be around the 5.70$ area. This looks like an unrealistic target and it is way too early to tell. But if the stock puts in a quick down move around the air pocket area, the aggressive bearish downside target will become more likely. Let’s see how KNDI deals with the black trendline I drew into the chart. KNDI will most likely show its hand very soon as it is trading at a critical juncture.
Losers average losers. – Paul Tudor Jones
Twitter: https://twitter.com/tischendorf
Investing in your education always pays. Learn how to read chart patterns like a pro! Tischendorf Letter Premium: https://members.tischendorf.com
