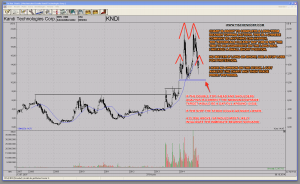
The chart of KNDI – Kandi Technologies the ‘Chinese TSLA – Tesla Motors’ is displaying several red flags indicating that the stock might have put in a long-term topping pattern. This looks like a clearly defined double top that is part of a bigger bearish head and shoulders pattern. The stock has broken the weekly moving average 30 to the downside. This is most often the first sign sellers are now in control. On the recent run that tested the all time highs the stock put in a gap around the 15 – 16$ area. That gap will now most likely act as strong resistance. Hence a stop loss above 16$ on a closing basis is a good price level to determine if the bearish assumption is valid.
I initiated a small short position. As usual, opinions and analyses are worth nothing unless price confirms them. So no matter if long or short the stock, use a stop loss to protect your capital. That way you won’t trade opinions, but simply trade price.
Click on KNDI chart to enlarge:
Be wary of the arrogant intellectual who comments from the stands without having played on the field. – Ray Dalio
Twitter: https://twitter.com/tischendorf
Investing in your education always pays. Learn how to read chart patterns like a pro! Tischendorf Letter Premium: https://members.tischendorf.com

{ 2 trackbacks }
Comments on this entry are closed.