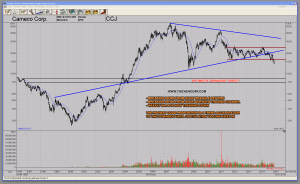
Right now one of the most visible and biggest Uranium stocks, CCJ – Cameco or CCO.TO in Canada, is offering a great trend following trading opportunity. I did a quick video analysis explaining what I see and analyzed the current technical situation from a psychological perspective.
The key points are the following:
Since Fukushima, which created a huge gap down in the charts, we first saw a downside move. Then CCJ proceeded to trade within a sideways trading channel for roughly 3 years. Price has now broken to the downside. That means everybody who is still holding the stock or added to their position post Fukushima is now showing a loss. The past 3 years can only be considered a ‘Hope Pattern’. Traders were hoping for a close of the gap down, or a return to ‘normal’, whatever that might mean.
Now the trend is accelerating to the downside. It looks like there is no escaping the truth anymore. This is the type of technical situation where traders are most likely to throw in the towel. My best guess is that more and more traders are going to want to exit no matter what until the stock experiences final capitulation.
For those not familiar with the implications of ‘Break-away gaps’ or ‘Hole in the wall patterns’ I recommend reviewing the following two links where I explain the concept in detail:
In the CCJ video I discuss potential downside price target areas and how to find them using prior consolidation periods in the chart. Enjoy the video and if you like it, share it!
Here’s the direct link if you can’t see the embedded video: CCJ – Cameco Video Analysis
As I outline in the CCJ – Cameco Video Analysis, a low risk way to profit from the current technical set-up would be to buy put options as your downside is limited.
Click on weekly CCJ chart to enlarge:
You can also monitor the always up-to-date U.TO – Uranium Participation Chart on my public list.
Conclusion: From a purely technical perspective the highest odds proposition is a trend acceleration to the downside until capitulation volume kicks in. So far no significant increase in volume is noticeable on the weekly chart. When volume starts to kick in I expect it to coincide with price moves to the downside. In simple terms: My job as a trader is to now apply a trend following approach and stay short until price tells me otherwise.
The whole secret to winning big in the stock market is not to be right all the time, but to lose the least amount possible when you’re wrong. – William J. O’Neil
Twitter: https://twitter.com/Tischendorf
Investing in your education always pays. Learn how to read chart patterns like a pro! Tischendorf Letter Premium: https://members.tischendorf.com
